Analyze
Analyze lets you compare data generated for test subjects in two different cohorts, based on criteria and points of comparison that you specify. Analyze is useful to help you test a hypothesis that involves the criteria and points of comparison that you select.
Overview of the UI
The following figure shows key areas of the Analyze interface:
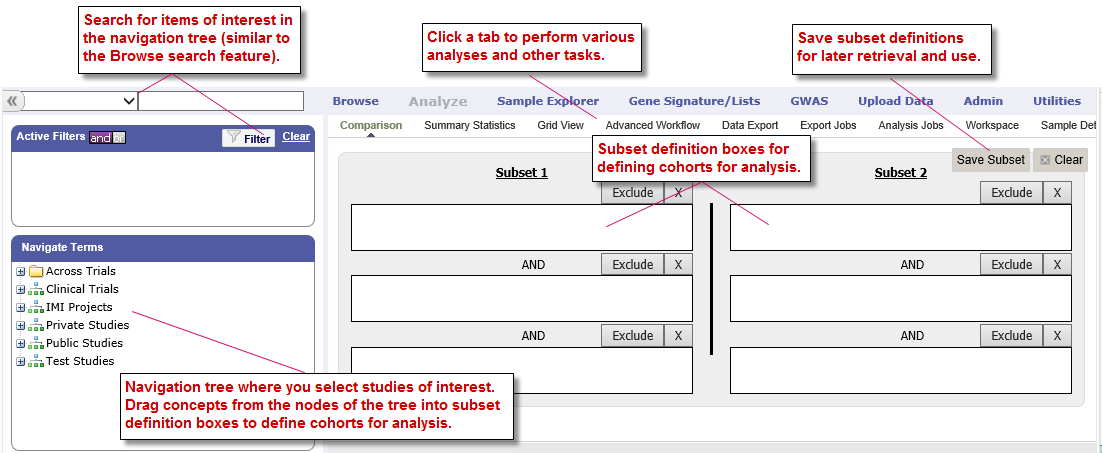
The page is divided into two panes:
Left pane
The Left pane provides a Microsoft Windows Explorer-like navigation tree where you select the criteria for membership in the cohorts and the points of comparison between the cohorts.
In this pane, select the study of interest and the concepts for defining cohorts for analysis.
Right pane
The Right pane lets you define the criteria that test subjects must satisfy to become members of one of the two cohorts being compared. Each of these cohorts is called a subset because it typically contains only some of the subjects involved in the study.
You define the criteria for the subsets in the subset definition boxes. Subjects who do not satisfy the criteria you define are excluded from the subsets and therefore, from the analysis.
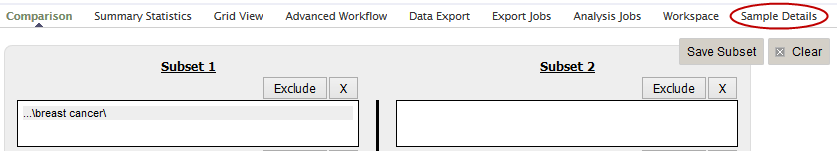
The following table describes the tabs and buttons in the right pane of Analyze:
- Comparison tab
Display the subset definition boxes. Click this tab from any other view to remove the currently displayed view (for example, Summary Statistics view or Grid view) and redisplay the subset definition boxes. This allows you to further refine the subsets for the comparison.
See Selecting Criteria.
- Summary Statistics tab
Generate the following:
- Tables and charts that provide information about the subjects in the subsets.
- Analyses of criteria included in the subset definitions.
The tables and charts are displayed in Summary Statistics view.
- Grid View tab
Display the comparison and analysis data in grid format.
- Advanced Workflow tab
Display advanced analyses and visualizations of the data — for example, heatmaps, scatter plots, survival analyses, and many others.
See Advanced Workflows.
- Data Export tab
Select data to export for further analysis in an external tool.
- Export Jobs tab
Display previously exported jobs.
See The Export Jobs List.
- Analysis Jobs tab
Review analyses you have run previously and view the status of analyses you have chosen to run in the background.
- Workspace tab
Perform actions related to a saved cohort definition for an analysis, including restoring the saved cohort definition back into the subset definition boxes.
- Sample Details tab
View information about the selected data in the Sample Explorer.
See Viewing Sample Data.
- Galaxy Export tab
Export data directly to the Galaxy platform.
- Genome Browser tab
View data in the Dalliance Genome Browser.
- MetaCore Enrichment Analysis tab
Provide enrichment of a gene list to evaluate the significance of the genes to the studied phenotype and/or patient cohort.
- Save Subset button
Save the subset definition. This allows you to regenerate the comparison at a later time without having to reconstruct the criteria used in the comparison.
- Clear button
- Clear all data that has been specified by the user, including the data in the subset definition boxes and in the Advanced Workflow variable input boxes.
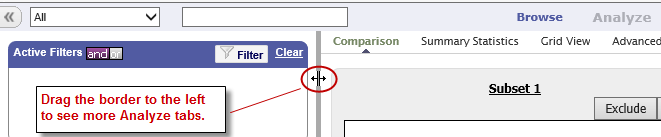
Note
If the tabs at the rightmost end of the tab bar are not visible, try shrinking the left pane by dragging the vertical border to the left:
Using Analyze — Basics
Three basic tasks are involved in using Analyze:
- Identify the study to include in the comparison. Using the Across Trials folder, multiple studies can be included in the comparison.
- Specify the criteria for membership in the two cohorts. Note that some analyses in Advanced Workflow only allow for the specification of one cohort at this time.
- Select the function to perform, such as Summary Statistics, Grid View, or Advanced Workflow, from the tab bar.
Note
You may see the notations NA and Unknown in the study data. NA indicates not applicable and Unknown indicates not available.
The Navigation Tree
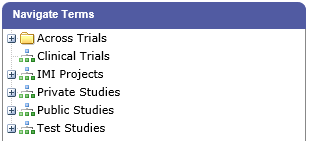
The Analyze navigation tree is located in the Navigate Terms pane:
The navigation tree looks and works much like Microsoft Windows Explorer. Windows Explorer is a hierarchy of folders, sub-folders, and files. The navigation tree is a hierarchy of folders and sub-folders (the branches) and values (the leaves) that reflect aspects of the trial, such as research metrics, compounds used, and patient demographics.
In Analyze, all levels of the tree, including branches and leaves, are referred to as nodes.
The following figure shows typical top-level nodes of a study. Some studies may not require all of these nodes, and others may require additional nodes:
Note
The nodes you see on your screen may differ from those listed here. Only those domains present in your data will appear in your navigation tree.
Visual Cues in the Navigation Tree
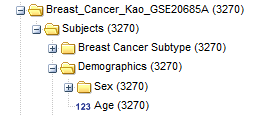
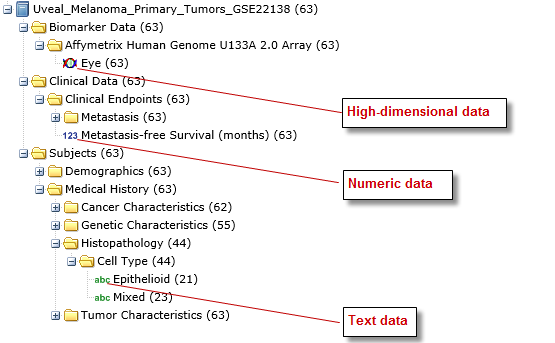
Each concept node in the navigation tree displays the following information about the concept:
- The numbers in parentheses at nodes of the tree indicate the number of subjects to whom that node applies. For example, in the figure below, there are a total of 167 subjects in the study:

Nodes within the Across Trials folder do not indicate the number of subjects associated with the node.
In tranSMART, data values are represented in one of three ways: by number, by text, or by high dimensional data (SNP, gene expression, etc.) stored as arrays.
The three types of data values and their associated icons are illustrated below:
Selecting Studies for Analysis
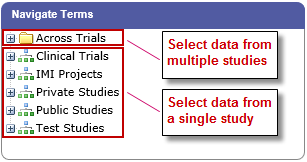
Select studies for analysis in the navigation tree, located in the Navigate Terms section of the left pane of the Analyze window.
You can select data from a single study, or you can select data from multiple studies located in the Across Trials folder.
To select a study, click the + icon ( ) next the study name:
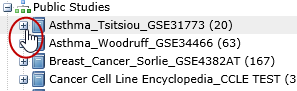
You can then drill down into the study to find the data to use to define the cohorts for the analysis.
Searching for a Study
You define search filters with the Analyze tool as you do with the Browse tool. For information, see Defining Search Filters.
Selecting Data from Multiple Studies in the Across Trials Folder
The Across Trials folder is a special folder that contains data from multiple studies. You defined cohorts from this folder in the same way that you define cohorts from a single-study folder.
Common categories of data from the multiple studies are loaded into the same nodes of the tree; for example, the Female node contains female subjects across all the studies that are loaded into the Across Trials folder.
Use the Across Trials folder to include data from multiple studies in your analysis. For example, you may want to determine whether age at diagnosis is correlated with survival in breast cancer patients, regardless of which study the subjects participated in.
Structure of the Across Trials Tree
The data in the Across Trials folder needs to be curated so that each study has the same hierarchical folder structure and naming conventions. Only those folders and values with the same names will be displayed in the Across Trials folder.
Public and Private Studies
Analyze studies can be either public or private. Public studies can be found in both the Public Studies folder of the Analyze navigation tree and in the research-specific folders.
You can perform all the operations described in this chapter on public studies. No special privileges are required.
To perform operations described in this chapter on a private study, a tranSMART Administrator must assign you access rights to the study. Access rights are based on the following access levels with appropriate privileges:
- VIEW
- Define the criteria for the cohorts to be compared, generate summary statistics for the cohorts, and specify points of comparison for the cohorts.
- EXPORT
- All privileges of the VIEW access level, plus the ability to export comparison data or expression data to a Microsoft Excel spreadsheet.
- OWN
- All VIEW and EXPORT privileges. This access level can only be assigned to the owner of the study.
If you do not have access rights to the study you want (that is, if the study is grayed out), contact a tranSMART Administrator. The administrator will contact the study owner to find out if you should be granted VIEW access, EXPORT access, or no access.
Note
Even if you have no access rights to a private study, you can read a description of the study. For information, see Viewing a Study Description.
Viewing a Study Description
You can view a description of any Analyze study, whether or not you have access rights to the study.
To view a description of a study:
in Analyze, open the top level node for the list of studies you are interested in; for example, click the + icon (
 )
next to Public Studies to open the list of public studies:
)
next to Public Studies to open the list of public studies: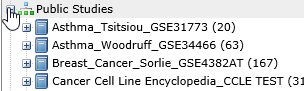
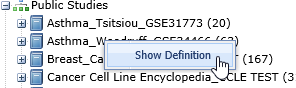
Right-click the particular study you are interested in.
Click the Show Definition popup:
The Show Concept Definition dialog box appears, showing the title, description, and other information about the study.
Serial Numeric Data
tranSMART supports serial numeric data (high or low dimensional); that is, a numeric variable that has been measured in a series of conditions for each subject (for example, several timepoints). The conditions cannot be specific to each subject but are shared by all subjects; for example, a measurement performed at 0, 7, 48, and 96 hours for the various subjects.
In the Analyze navigation tree, serial data is represented by several leaves of the same type in a folder, with each leaf representing a condition with a label; for example:
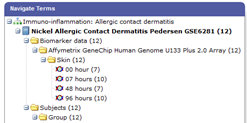
In the tranSMART database, each condition can be described by a numeric value (such as for time series or dose response) or by a categorical value (such as in the case of a series of tissues derived from each subject).
When the value characterizing each sample is numeric, it is also associated with a unit. In the case of time series, for example, the value associated with each sample will be time duration, and the unit can be hours (a single unit is used for the complete series).
In Analyze, serial data specificities can be best exploited using Line Graph and Heatmap.
Defining the Cohorts
You define the cohorts for an analysis by selecting criteria that members of each cohort must satisfy. For example, cohort members might be required to satisfy a weight or age requirement. Analyze lets you build a set of criteria for each cohort that can be as simple or as complex as you need.
The cohorts you define are called subsets. Typically, after your criteria are applied, the members of a resulting cohort are a subset of all the subjects that participated in the study.
Selecting Criteria
To define a cohort, select criteria (called concepts) from a study in the navigation tree and drag them into the subset definition boxes. With studies in the Across Trials folder, concepts include data from multiple studies.
Linked event data, non-linked event data, and NGS data can all be used to populate the cohorts.
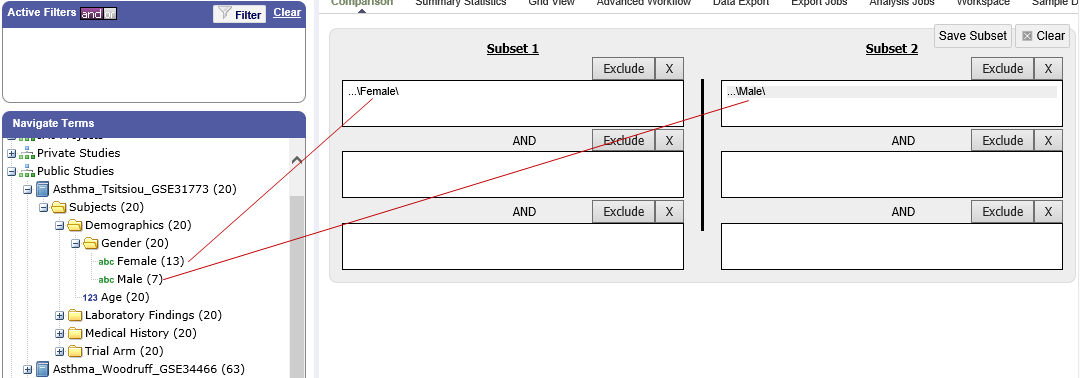
Single Study Example
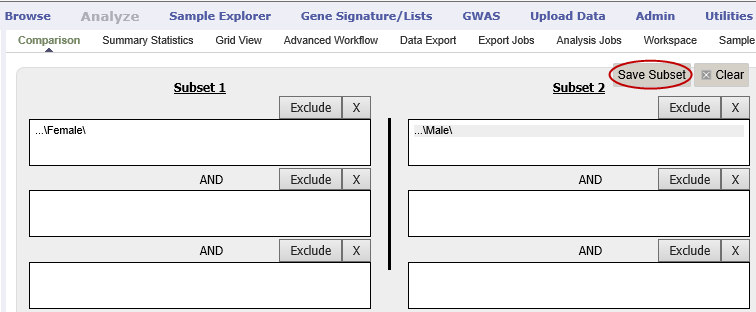
In the following example from a single asthma study, female patients have been dragged into Subset 1 and male patients into Subset 2:
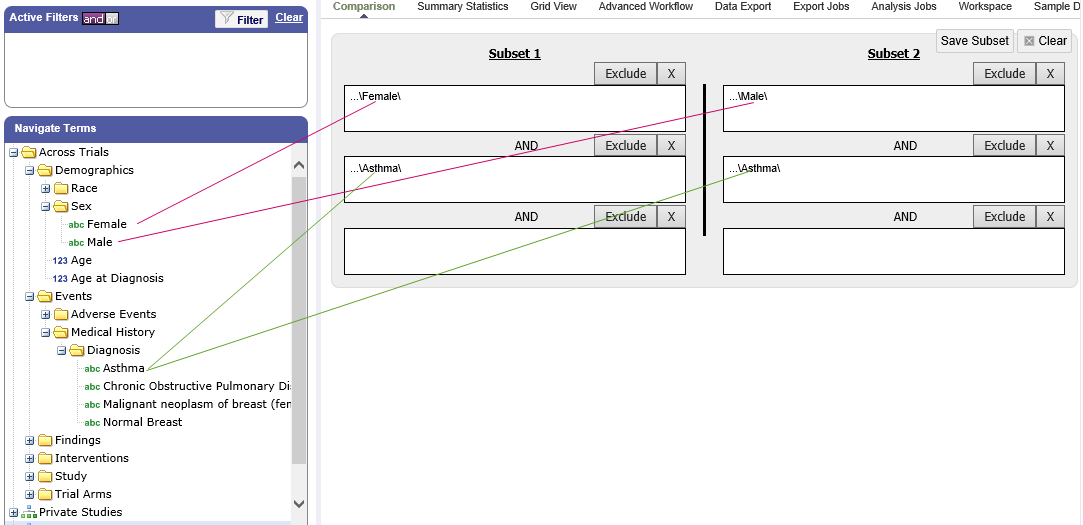
Across Trials Example
In the following example, males and females from the studies loaded into the Across Trials folder have been dragged into Subsets 1 and 2. However, because the concept Asthma has also been dragged into both Subset 1 and Subset 2, the cohorts include only males and females from the asthma studies in the Across Trials folder, not males and females from any of the other studies in the Across Trials folder.
Specifying a Numeric Value
When you drag a numeric concept into a subset definition box, the Set Value dialog box appears:
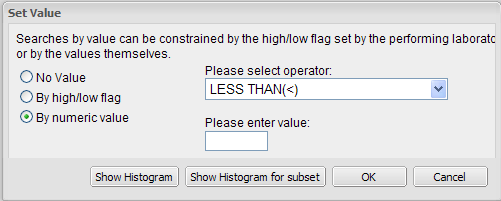
Use the Set Value dialog to specify how you want to constrain the numeric values to use in the subset definition. To do so, first select one of the following choices:
- No Value
Values are not constrained. All the numeric data associated with the concept are factored into the subset definition.
If you select No Value, no other information is required. Click OK to add the concept with all its associated numeric data to the subset.
- By high/low flag
If the data was grouped into high/low/normal ranges during curation and loading, it is possible to select the range to factor into the subset definition.
When you select By high/low flag, the Please select range field appears. Select the range you want and click OK.
- By numeric value
Values are constrained by an exact value or a range of values.
After you select By numeric value:
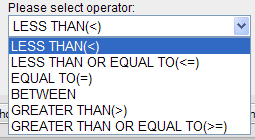
Select one of the following numeric operators in the Please select operator dropdown:
In Please enter value, type the numeric value that the operator applies to. For example, to constrain the ages of subjects to 50 years or younger, select LESS THAN OR EQUAL TO(<=) in the dropdown, then type 50 in the Please enter value field.
Click OK.
See the next section for information on viewing the numeric values associated with the concept and that you can select from.
Note
When finished defining the numeric constraint on the Set Value dialog,
be sure to click OK and not press the Enter key. Pressing Enter will
activate the subset button that has focus — the Exclude button in the example below:
 |
|
Viewing the Numeric Values Associated with a Concept
Note the buttons Show Histogram and Show Histogram for subset in the Set Value dialog. The histograms show how the numeric values associated with the concept that you placed in the subset box are distributed among the subjects across both subsets, or in the particular subset you are currently defining, respectively.
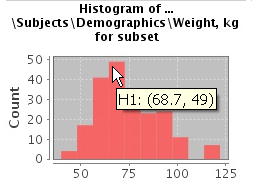
A histogram may be helpful in determining the number to set as the constraining factor for a concept. For example, suppose you drag a Weight concept into a subset box, then click Show Histogram for subset. In the following histogram of the weights of test subjects, the weights range from about 25 kg to just under 125 kg. The largest bin represents fewer than 50 subjects. You may want to use these weight parameters to help you determine the value to set for the weight concept.
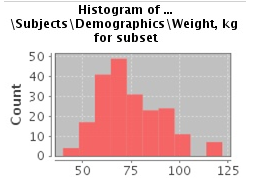
You can get more specific information about the number of subjects represented by a particular bin and the average of the values in the bin by hovering the mouse cursor over the bin you are interested in. For example, in the following figure, the largest bin represents 49 subjects with an average weight of 68.7 kg:
Joining Multiple Criteria for a Subset Definition
Multiple criteria for a subset definition are joined by one of the following logical operators: AND, OR, or AND NOT.
The rules for joining multiple criteria are as follows:
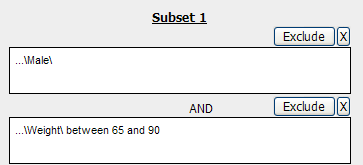
- Criteria in separate subset definition boxes are joined by an AND operator.
For example, the following definition boxes select only male subjects, AND males whose weights are between 65 kg and 90 kg:
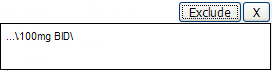
- Criteria within the same subset definition box are joined by an OR operator.
For example, to use the extreme ends of the weight scale for your weight criterion, you might add the following to a definition box:
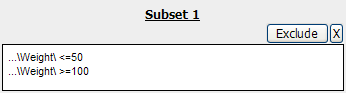
These criteria select subjects whose weight is either 50 kg or less, OR 100 kg or greater.
- To join a definition box with an AND NOT operator, click the Exclude button above the definition box.
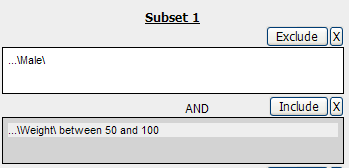
Note that when you click the Exclude button, the button label changes to Include, allowing you to join the criteria in the box with an AND operator later if you choose.
Modifying or Deleting Criteria
To delete or modify a criterion in a subset definition box, right-click the criterion and select either Delete or Set Value.
Note
Set value displays only when the criterion is a numeric value.
Show Definition displays for any type of criterion. Use this option to review the node before modifying or deleting it.
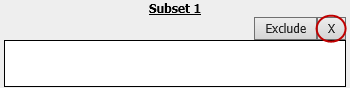
To remove the entire contents of a subset definition box from the subset
definition, click the X icon ( ) above the box:
Saving Subset Definitions
You can save your subset criteria in order to regenerate the subsets at a later time without having to define the criteria again.
To save a subset definition:
In Analyze, select a study of interest.
Define the cohorts whose data points will be represented.
Click the Save Subset button to save the criteria:
The Save Subsets dialog box appears:
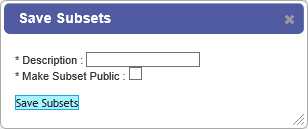
Enter a description of the subsets in the Description field.
Optionally, clear Make Subset Public to make this subset available only to yourself:
- If the subset is public, all others are able to view it.
- If the subset is not public, only the user who created it can view it.
Click Save Subsets.
The subset information displays immediately in the Workspace tab in the Subset Manager portion of the Workspace page:
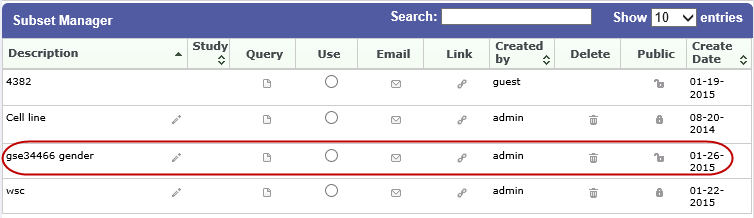
For information about the Workspace tab, including retrieving saved subsets, see Retrieving Saved Subset Definitions.
Retrieving Saved Subset Definitions
The Workspace tab of the Analyze window is where a saved subset definition can be retrieved.
To retrieve a saved subset definition, click the corresponding radio button in the Use column:
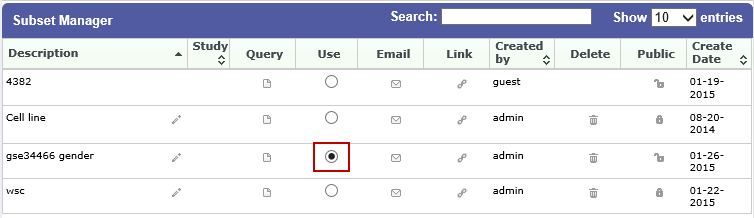
The retrieved subset definition remains in the Subset Manager until you explicitly delete it.
For information on saving a subset definition, see Saving Subset Definitions.
Subset Manager Overview
The following list describes the features of the Subset Manager:
- Search
- In this field, type one or more characters of a subset definition description. As you type, tranSMART refines the list to include only the studies that match what you type.
- Show n entries
- Specify the maximum number of studies to include in a single page of the list.
- Description
The description provided for the subset when saved. Also:
- Click the pencil icon to edit the subset definition description. Only the user who created the subset definition can edit the description.
- Click the arrow icon next to Description to sort the list alphabetically by the descriptions.
- Study
- The study ID. Click the arrow icon next to Study to sort the list by study IDs.
- Query
- Hover the mouse pointer over to review a saved subset definition without returning to the Comparison tab.
- Use
Click the Use radio button to populate the subset definition boxes on the Comparison tab with the saved criteria, then click OK to acknowledge the message that any existing criteria in the subset definition boxes will be overridden.
After you click OK, the Comparison tab appears with the subset boxes populated with the saved criteria.
- Click the Email icon to email the saved subset definition to yourself and colleagues, as appropriate.
- Link
- Click the Link icon to see the URL of a subset definition.
- Created by
The username of the person who created the subset definition.
Click the arrow icon next to Created by to sort the list by usernames.
- Delete
Click the Delete icon to delete this subset definition from the Subset Manager list and tranSMART.
Note: Only the user who created the subset definition can delete it.
- Public
Indicates whether the subset definition will be accessible by others or only by the person who created and saved the subset definition or by an administrator. The Public setting is the default when the subset definition is saved.
- Public (
): Accessible by the user who saved the subset definition and others.
- Private (
): Accessible only by the user who saved the subset definition.
Note: If a subset is based on a study that a user does not have sufficient privileges to see, the user will not be able to restore the subset definition to the subset definition boxes. Seeing a saved subset definition does not grant new privileges to users for the associated study.
- Create Date
- The date the subset definition was created and saved. Click the arrow next to Create Date to sort the list by date.
- First/Previous/Next/Last
- Navigate through the pages of a multi-page list.
Exporting Cohort Data
You can export data for one or both cohorts by defining the cohort(s) and clicking the Data Export tab. You can either download the data immediately after the export, or you can run the export in the background and download the data at a later time from the Export Jobs tab.
Downloaded data is saved to a location you specify in tab-separated format. Export metadata (information about the cohort definition and filters that selected the data to export) is downloaded in a separate file from the data itself.
To export data to your local machine or a network location:
Define one or both cohorts as described in Defining the Cohorts.
Click the Data Export tab. The Data Export page appears with your selected cohorts.
Optionally, drag additional nodes from the study into the export criteria to filter the data to export:
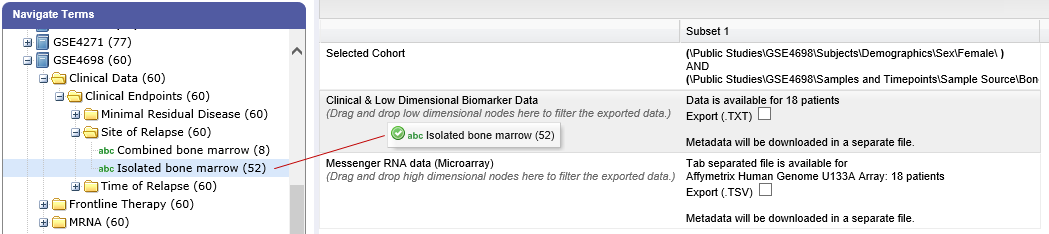
Because some studies have hundreds of concepts associated with each patient, adding one or more filters allows you to limit the exported data to only you need to work with.
Select the checkbox for the type of data to export:
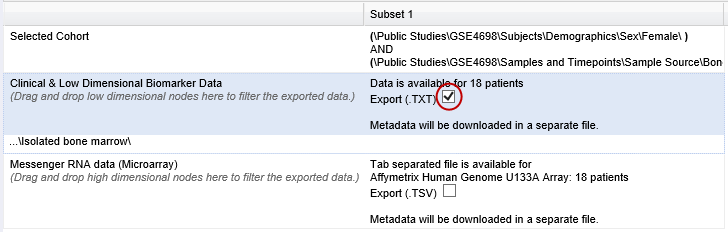
Above, only clinical and low dimensional data is being exported.
Click the Export Data button at the bottom of the page.
Do one of the following:
- When the export completes, download the data to your PC or a network location.
- With a large data set, click the Run in Background button on the Job Status dialog box. You can download the data at a later time from the Export Jobs tab.
- Optionally, click the Cancel button to cancel the export.
Both exported jobs and canceled jobs appear listed on the Export Jobs tab. Jobs remain listed on this tab for seven days. See The Export Jobs List for information about this list.
The Export Jobs List
A list of all exported jobs over the last seven days is displayed when you click the Export Jobs tab. The list includes all jobs: successes, errors, and pending jobs.
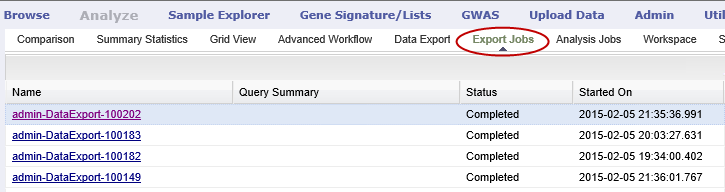
The list contains the following columns:
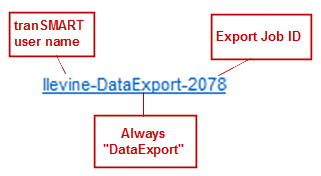
- Name
- The name of the export job. Jobs use the naming convention: User - Type of Job Run - Job ID:
- Query Summary
- Displays the query that was run to generate the subset.
- Status
The status of the export job:
- Completed — The job has finished and the data is available for download.
- Started — The job has been started and is still processing.
- Error — The job did not complete due to an error.
- Cancelled — The job was cancelled and will not complete.
- Started On
- The date and time that the export was started.
Exporting Data Directly into Galaxy
If you have the Galaxy data analysis tool installed, you can export cohort data from tranSMART into Galaxy in either of these ways:
- Export the data and download the data files to your local PC or a network location, using the tranSMART Data Export and Export Jobs tabs, and then open Galaxy and import the data.
- Export the data directly into Galaxy using the Galaxy Export tab.
For information about the Galaxy software, see http://galaxyproject.org/.
Note
Exporting data into Galaxy using the Galaxy Export tab requires both of the following: - That a tranSMART administrator has associated your tranSMART user ID with a Galaxy key. - That Galaxy be configured to support exports from tranSMART. See the Galaxy documentation for configuration instructions.
To export data using the Galaxy Export tab:
Define one or both cohorts as described in Defining the Cohorts.
Click the Data Export tab and define the data to export, as described in steps 2 through 4 in section Exporting Cohort Data.
Click the Export Data button at the bottom of the page, but do not download the data when prompted to do so.
Note that data exports are listed on both the Export Jobs tab and the Galaxy Export tab.
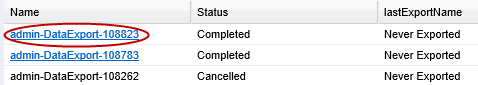
Click the Galaxy Export tab:
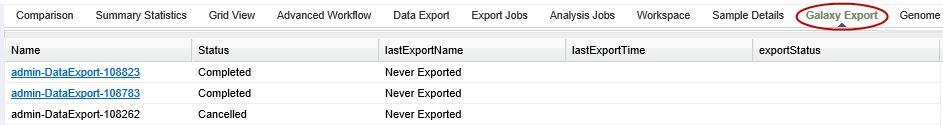
When the Status column for the exported data shows Completed, click the name of the job to export to Galaxy:
The Name dialog box appears.
Type the name of the Galaxy data library where the data will be exported, then click OK.

Click the Refresh button at the bottom of the page.
The status of the export is updated as shown below:
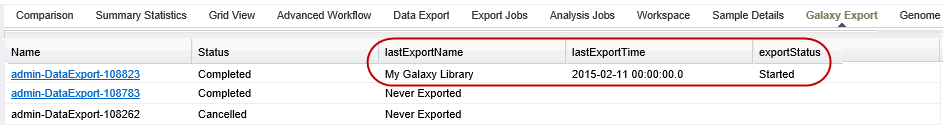
When the export to Galaxy is complete, the completion status is reflected in the exportStatus column.
Viewing Sample Data
If the cohort data includes data that has been loaded into the Sample Explorer, you can view information about the sample data without having to explicitly open the Sample Explorer and searching for the data.
To view sample data for the cohort(s) defined in Analysis:
Define one or both cohorts as described in Defining the Cohorts.
Click the Sample Details tab:
The Sample Explorer opens, displaying any cohort data that has been loaded in the Sample Explorer:
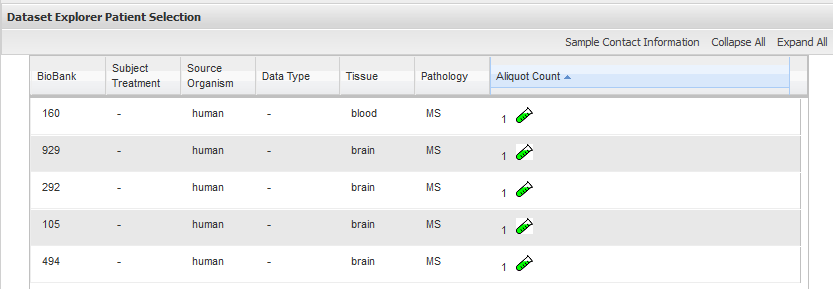
For information about this page of the Sample Explorer, see View and Refine Sample Search Results.