HiDome
Many projects have loaded some form of high dimensional data into their tranSMART instances. The main focus of High Dimensional data and Omics Exploration is to enable cohort selection based on high dimensional data. This allows new types of patient subsets to be created, which in turn will feed new downstream analyses.
HiDome makes defining a filter as simple as possible. When using a filter on age for example, a researcher already knows what values would make sense to define a range. In a high dimensional data node, a researcher generally does not know the range of values that is present as these values depend on the data type, screening technology, normalization methods, and so on. HiDome facilitates a way to clearly convey to the researcher the impact his filter is going to have by showing histograms of the chosen filter.
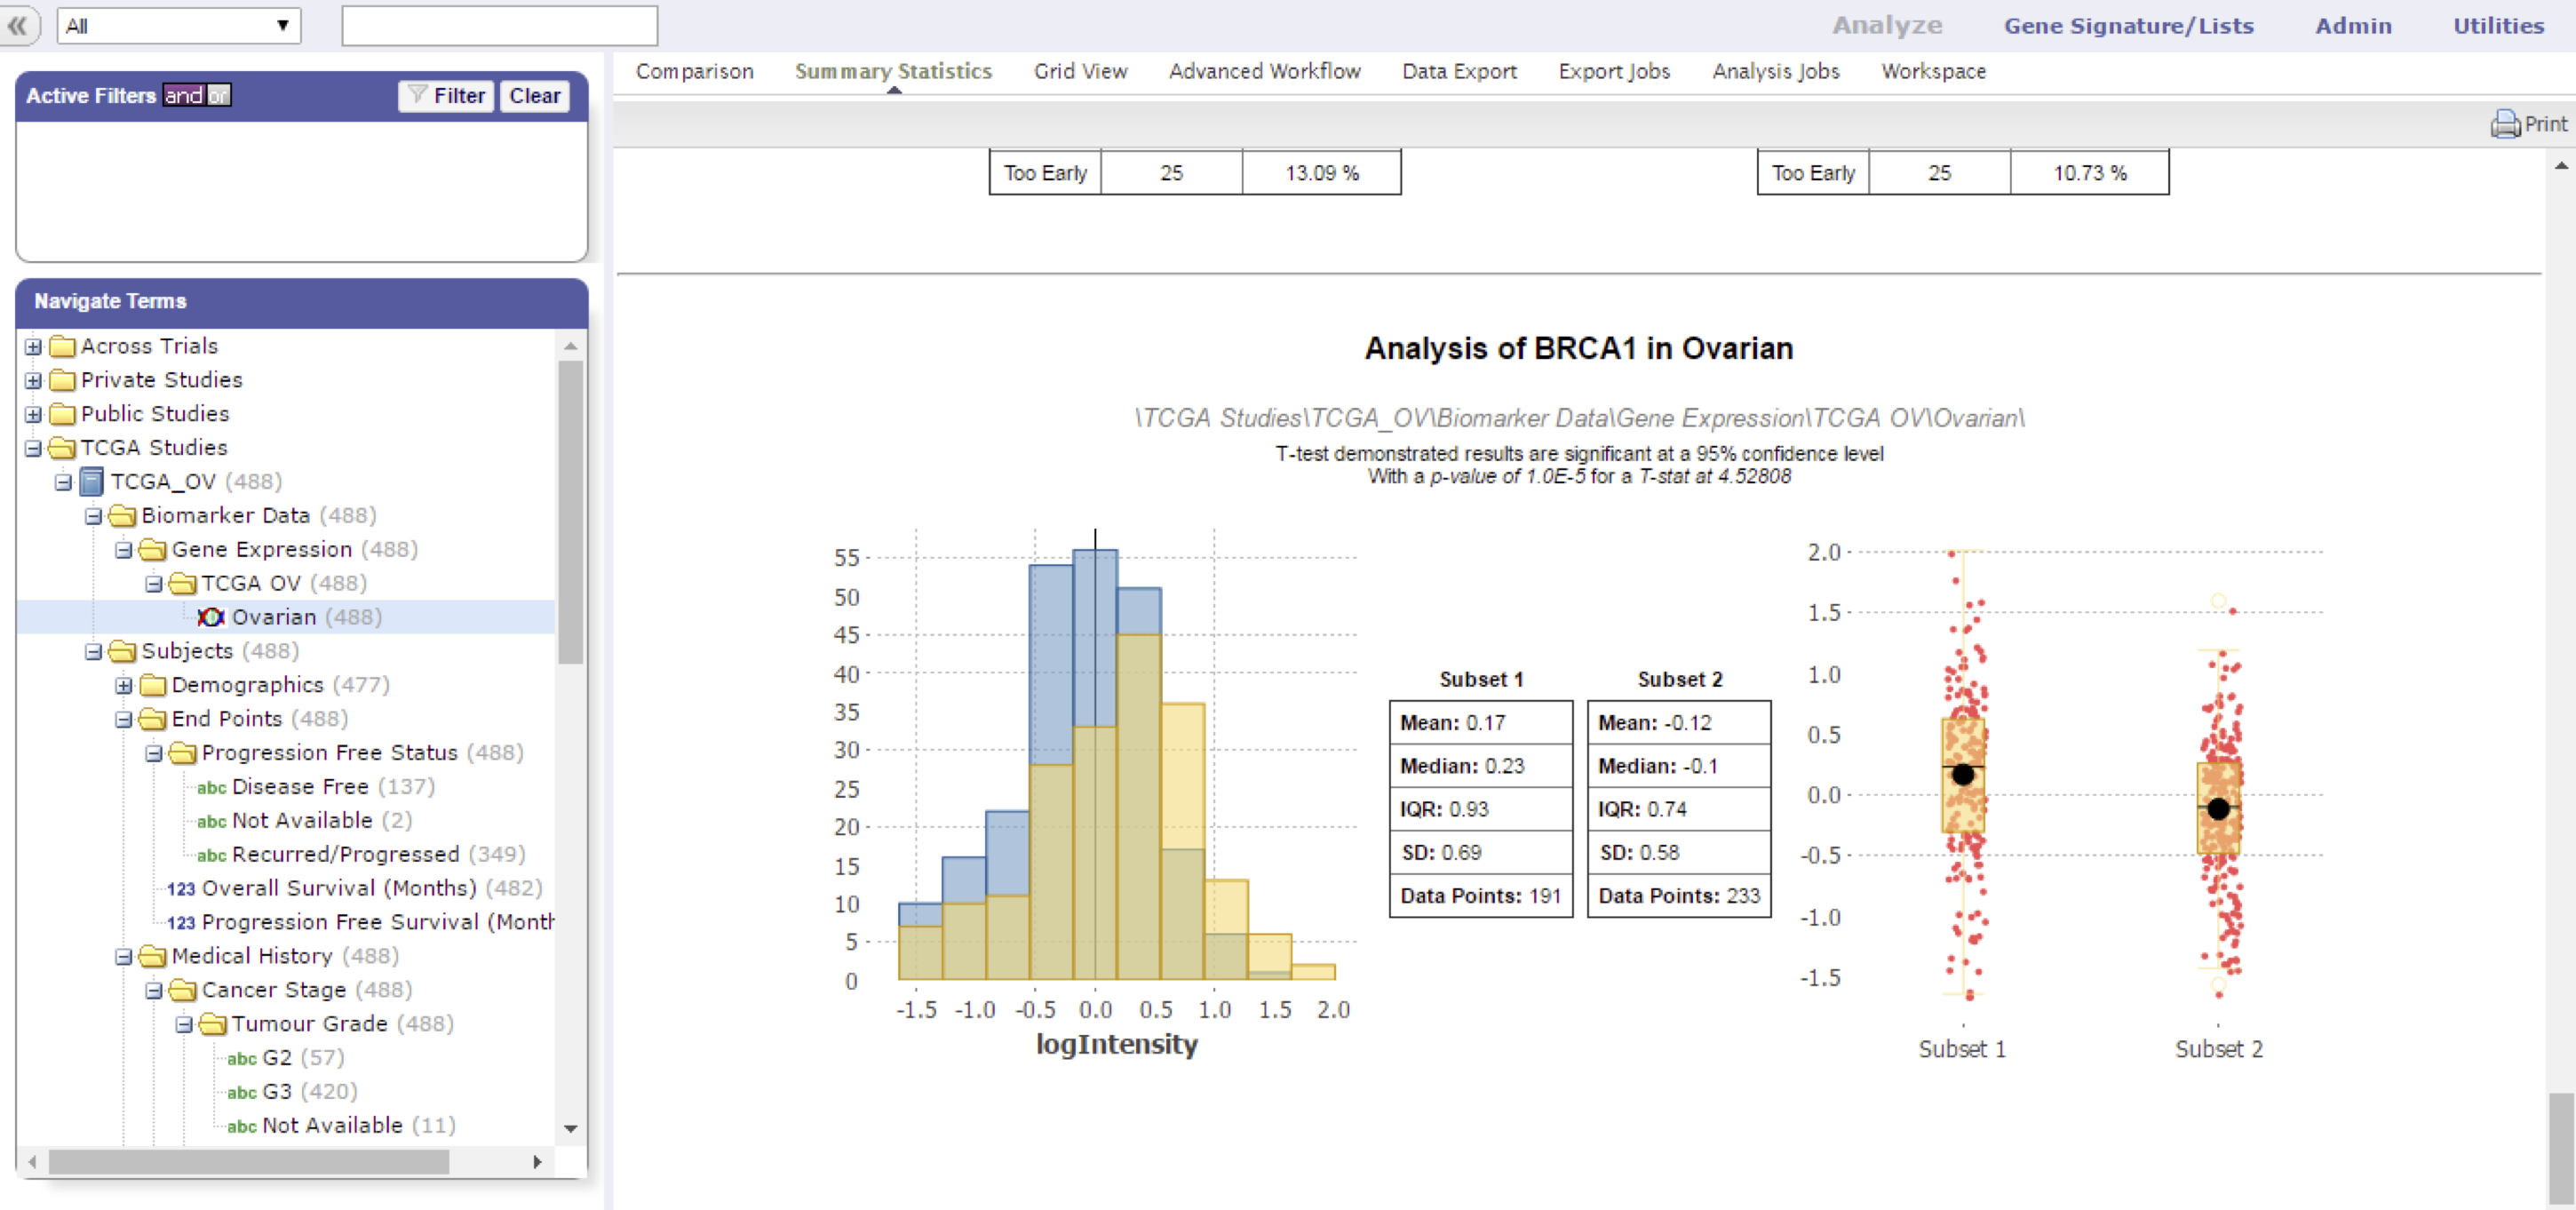
Finally, just like a regular numerical variable, the high dimensional variable, will be visualized in the Summary Statistics and Grid View.
Key features of HiDome:
- Cohort selection based on high dimensional data already present in the platform
- User-friendly searching and filter creation
- Visualization of the chosen property
- Support for many different types of HDD:
- Microarrays
- RNAseq
- Proteomics
- Metabolomics
- miRNA qPCR panels
- aCGH
How does it work?
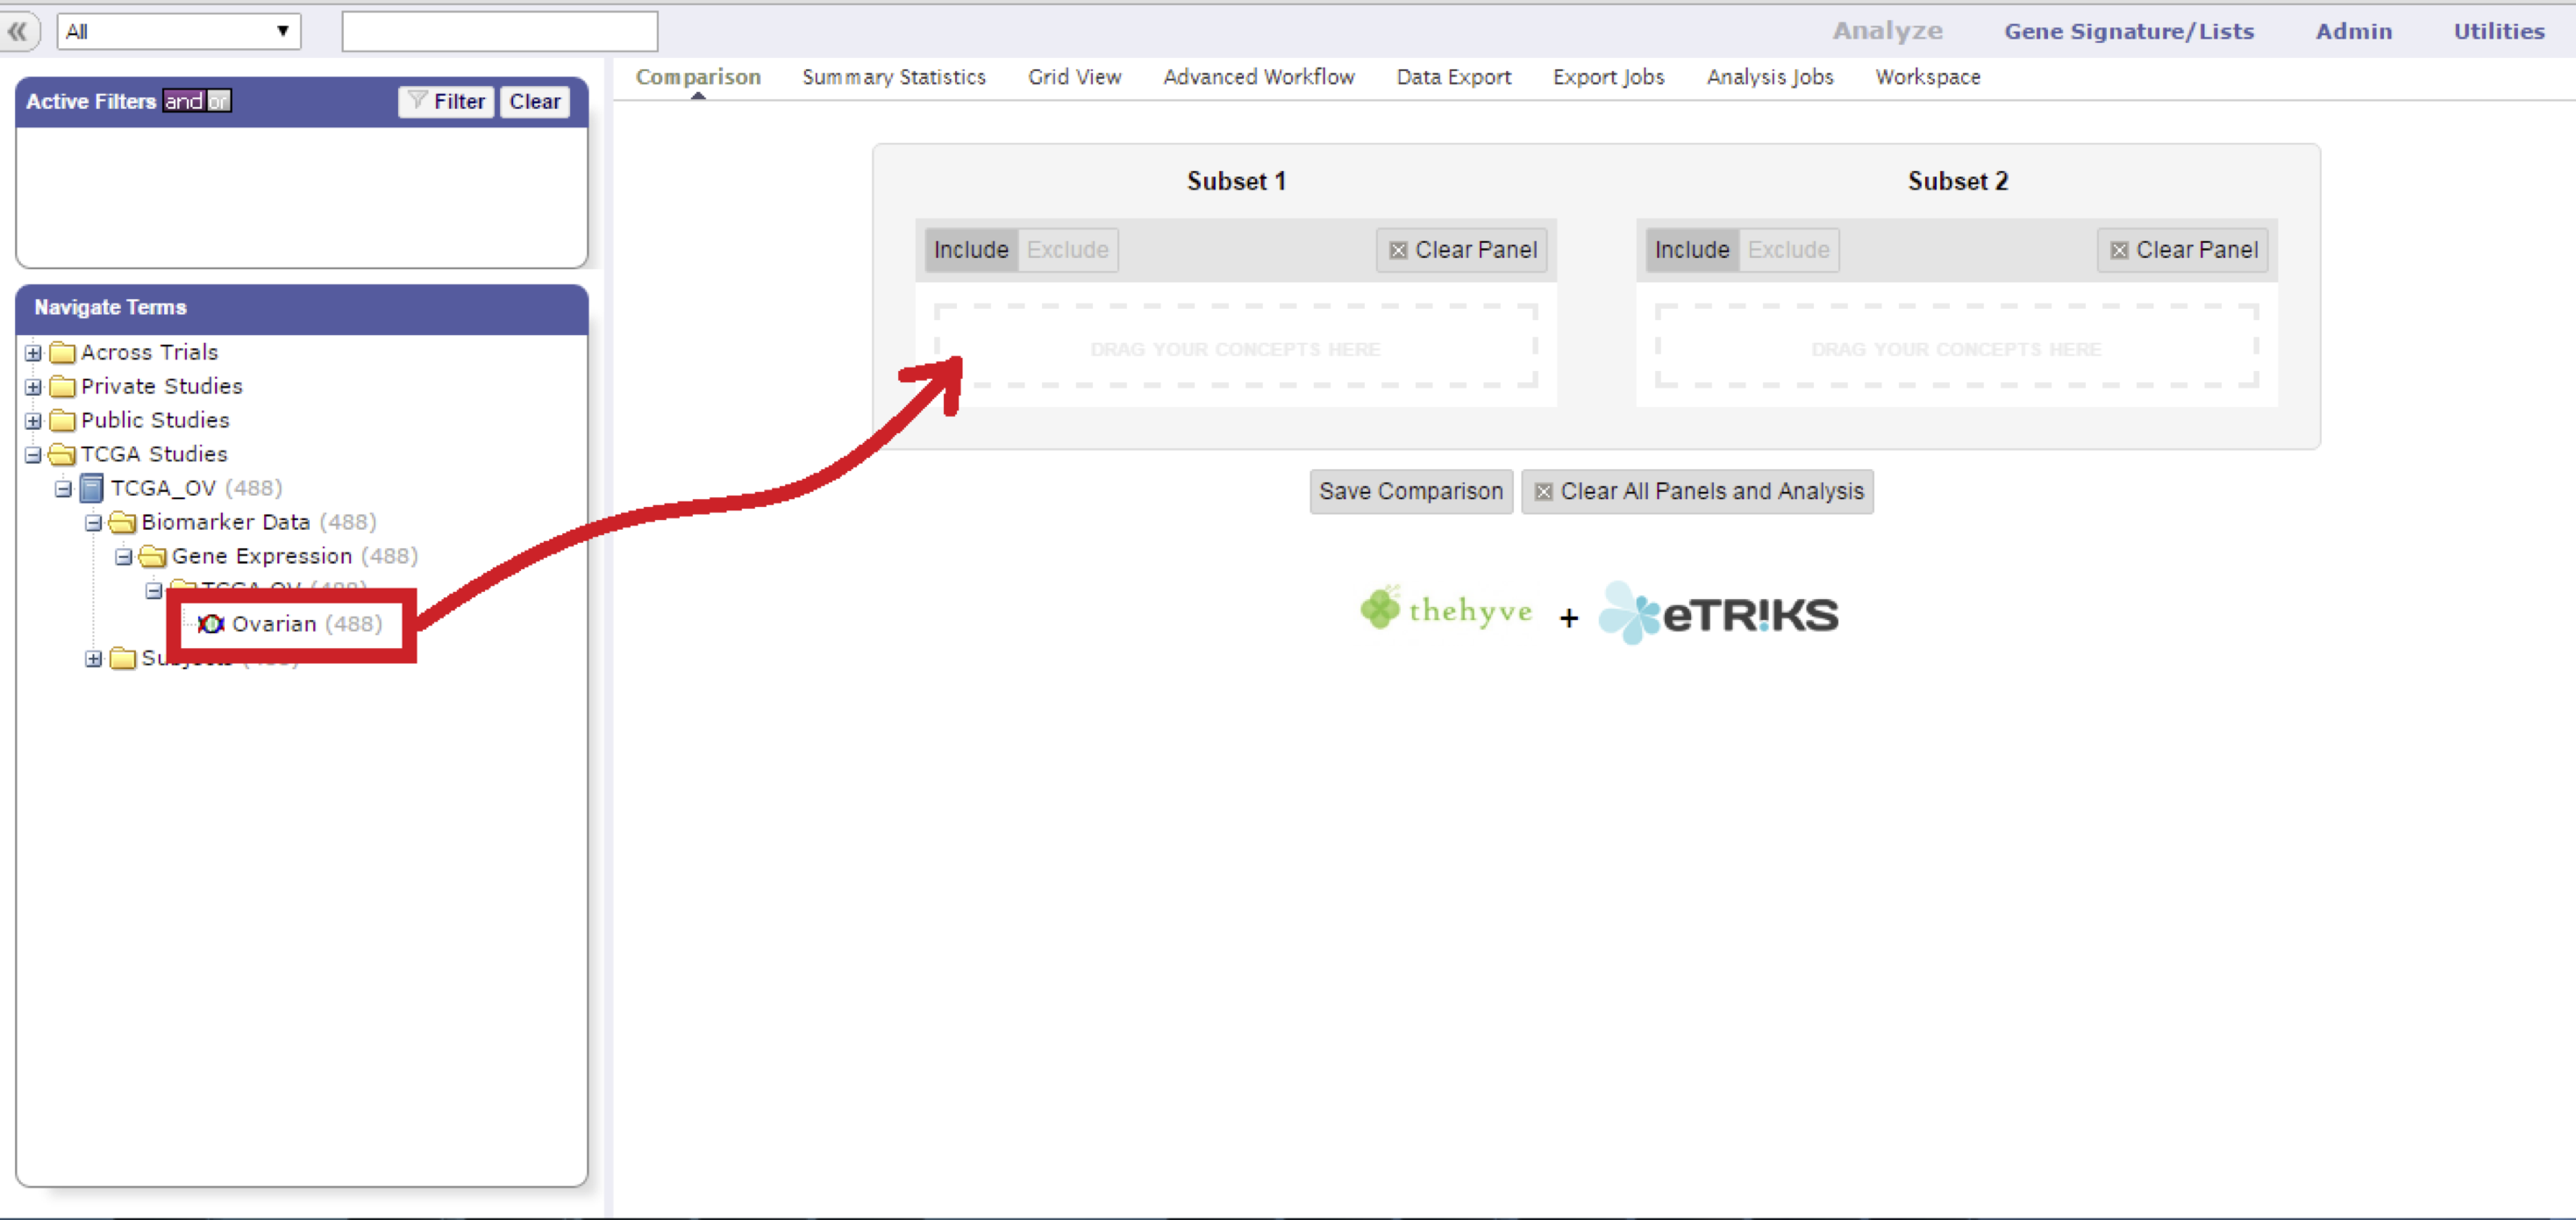
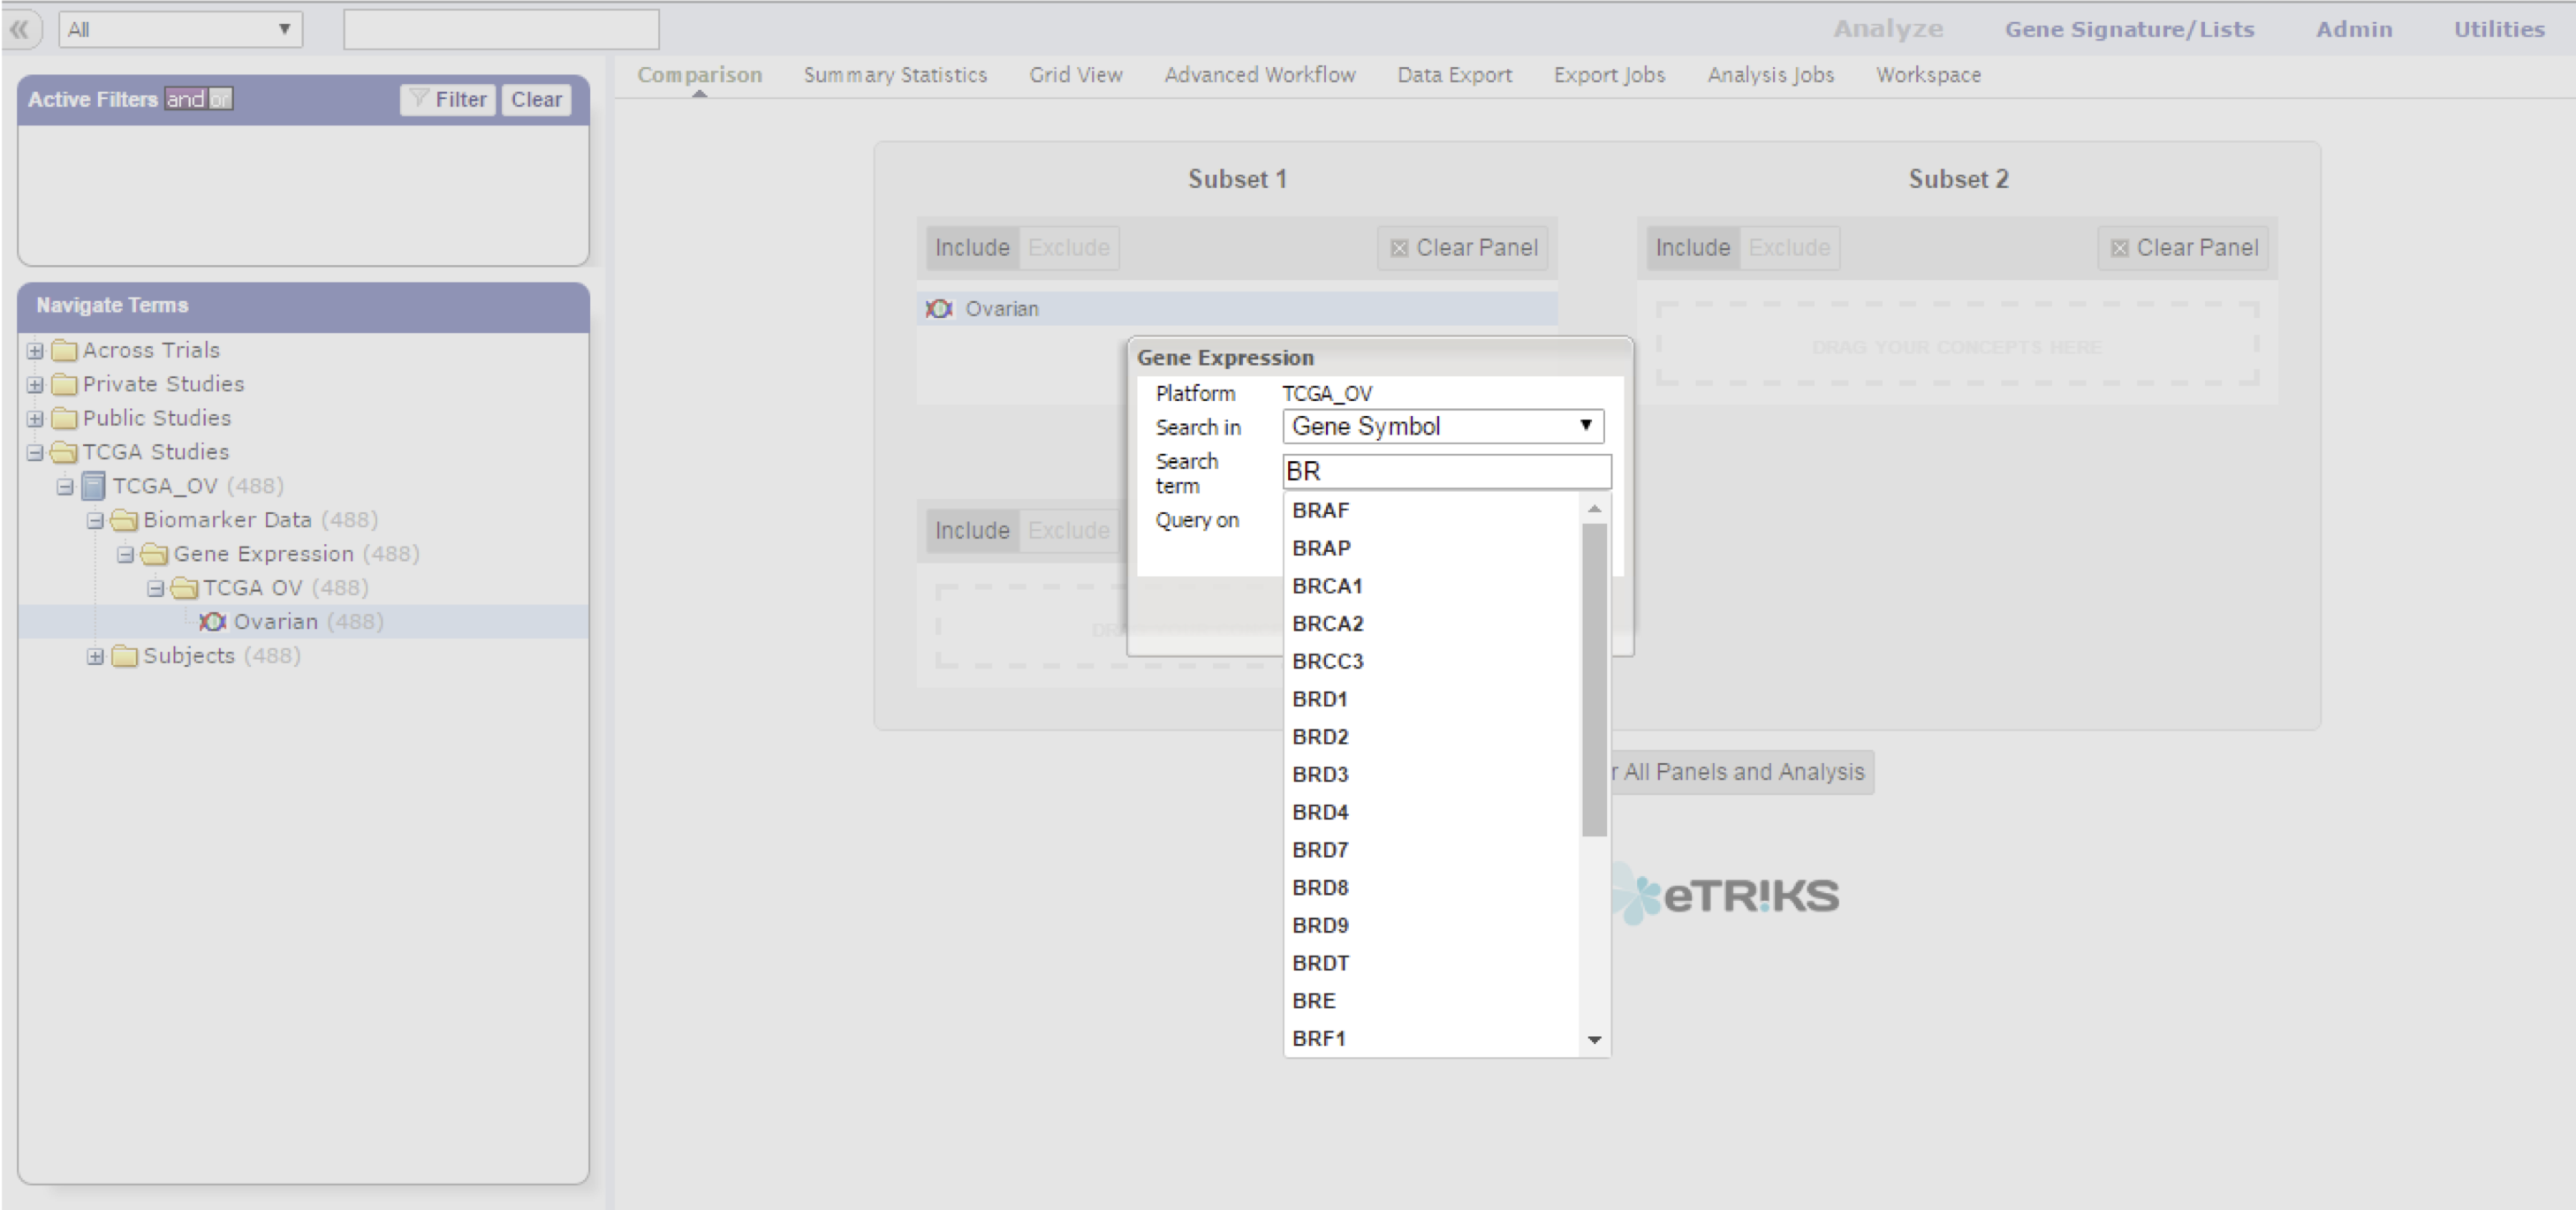
Drag a high-dimensional node into the comparison box.
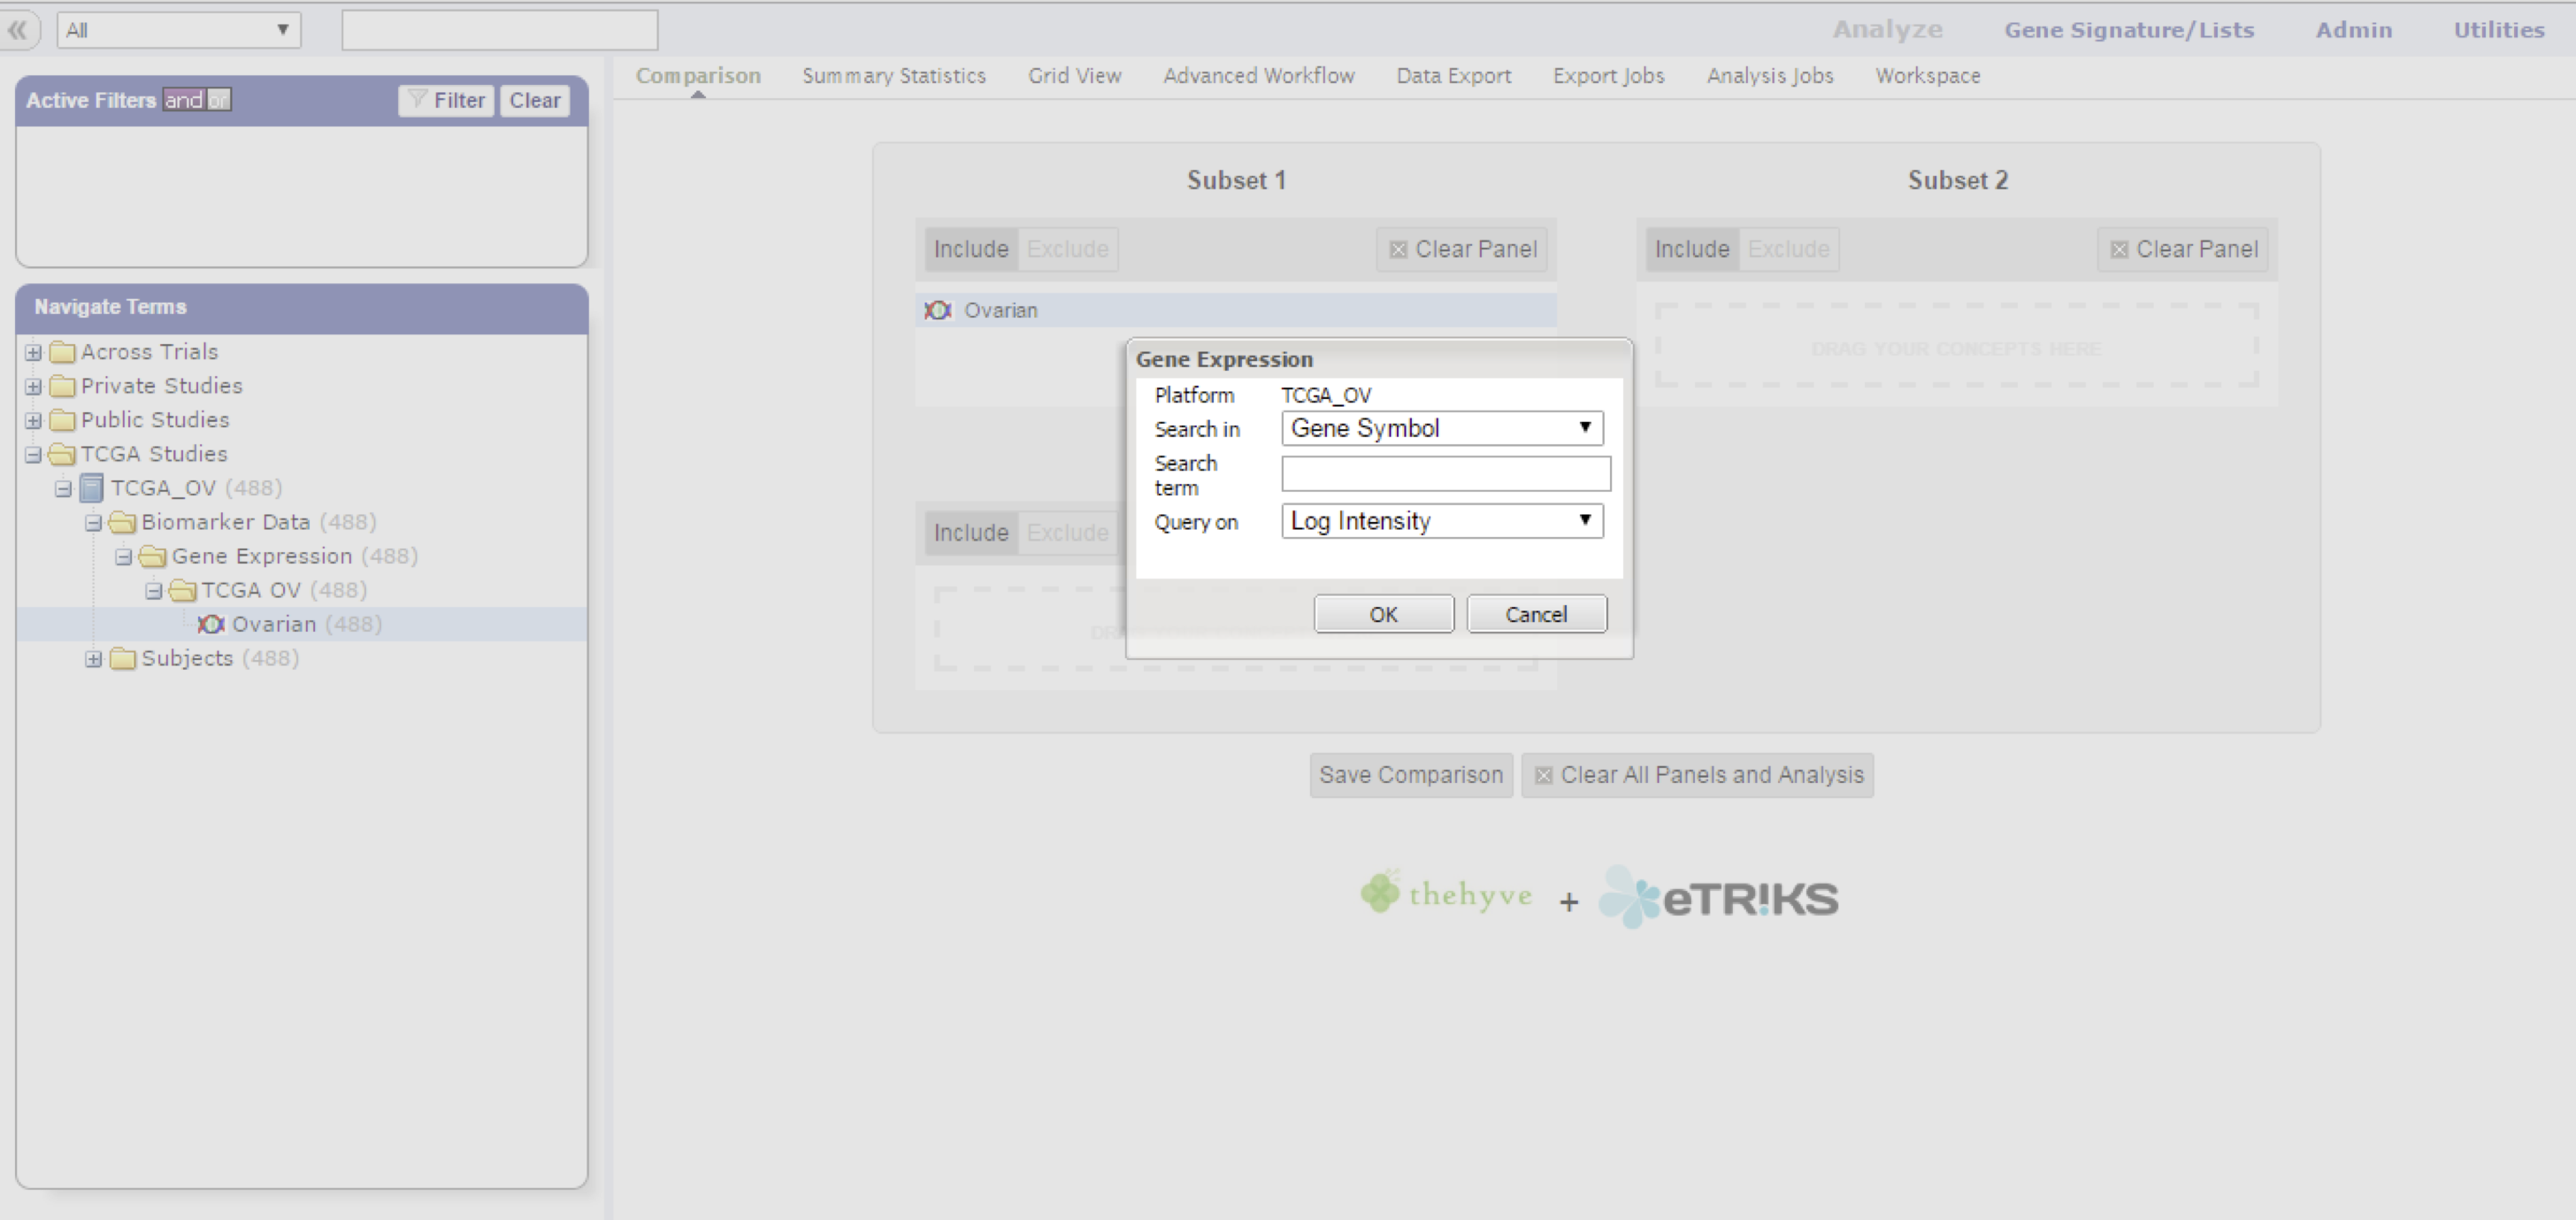
Fill in the gene, probe, or region of interest, and select the value projection to filter on.
Note
Pressing the down arrow (or any other key) starts a dropdown with all possible markers as taken from the platform definition of this particular data node.
Not all possible marker types will have associated data points, you might have to select the marker type that does by selecting the type in the Search in dropdown first.
Note
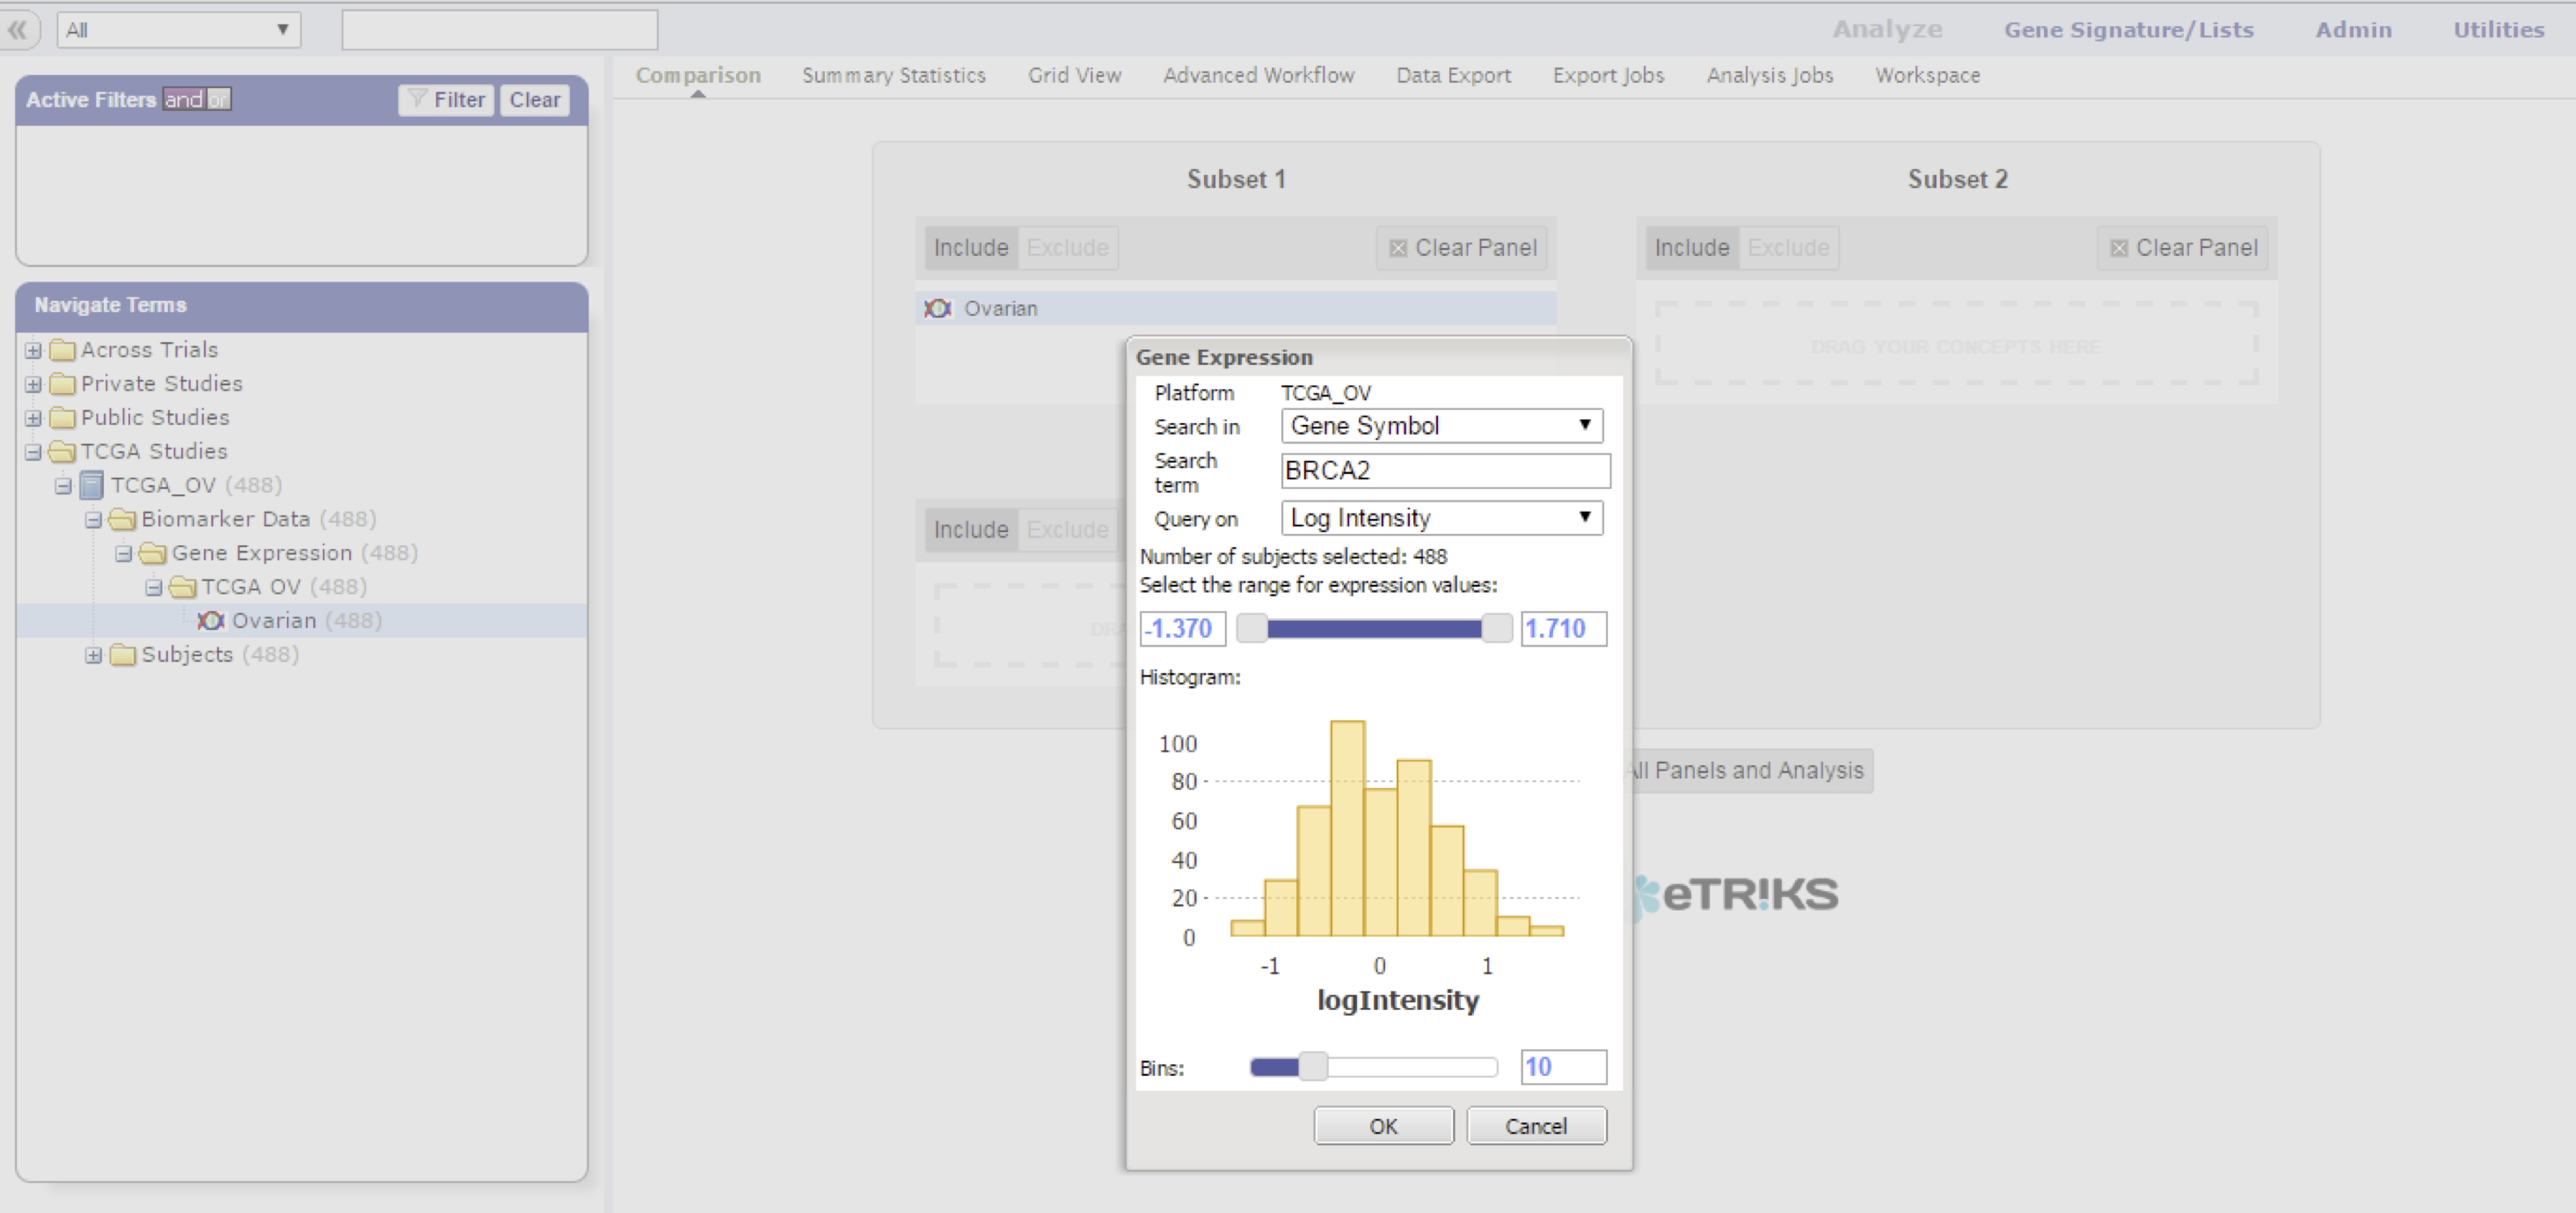
The z-score projection uses the values as calculated during the loading process into tranSMART, see Z-score calculation.
A histogram appears to help you set limits for the cohort subset selection. Click OK to start working with your subset.
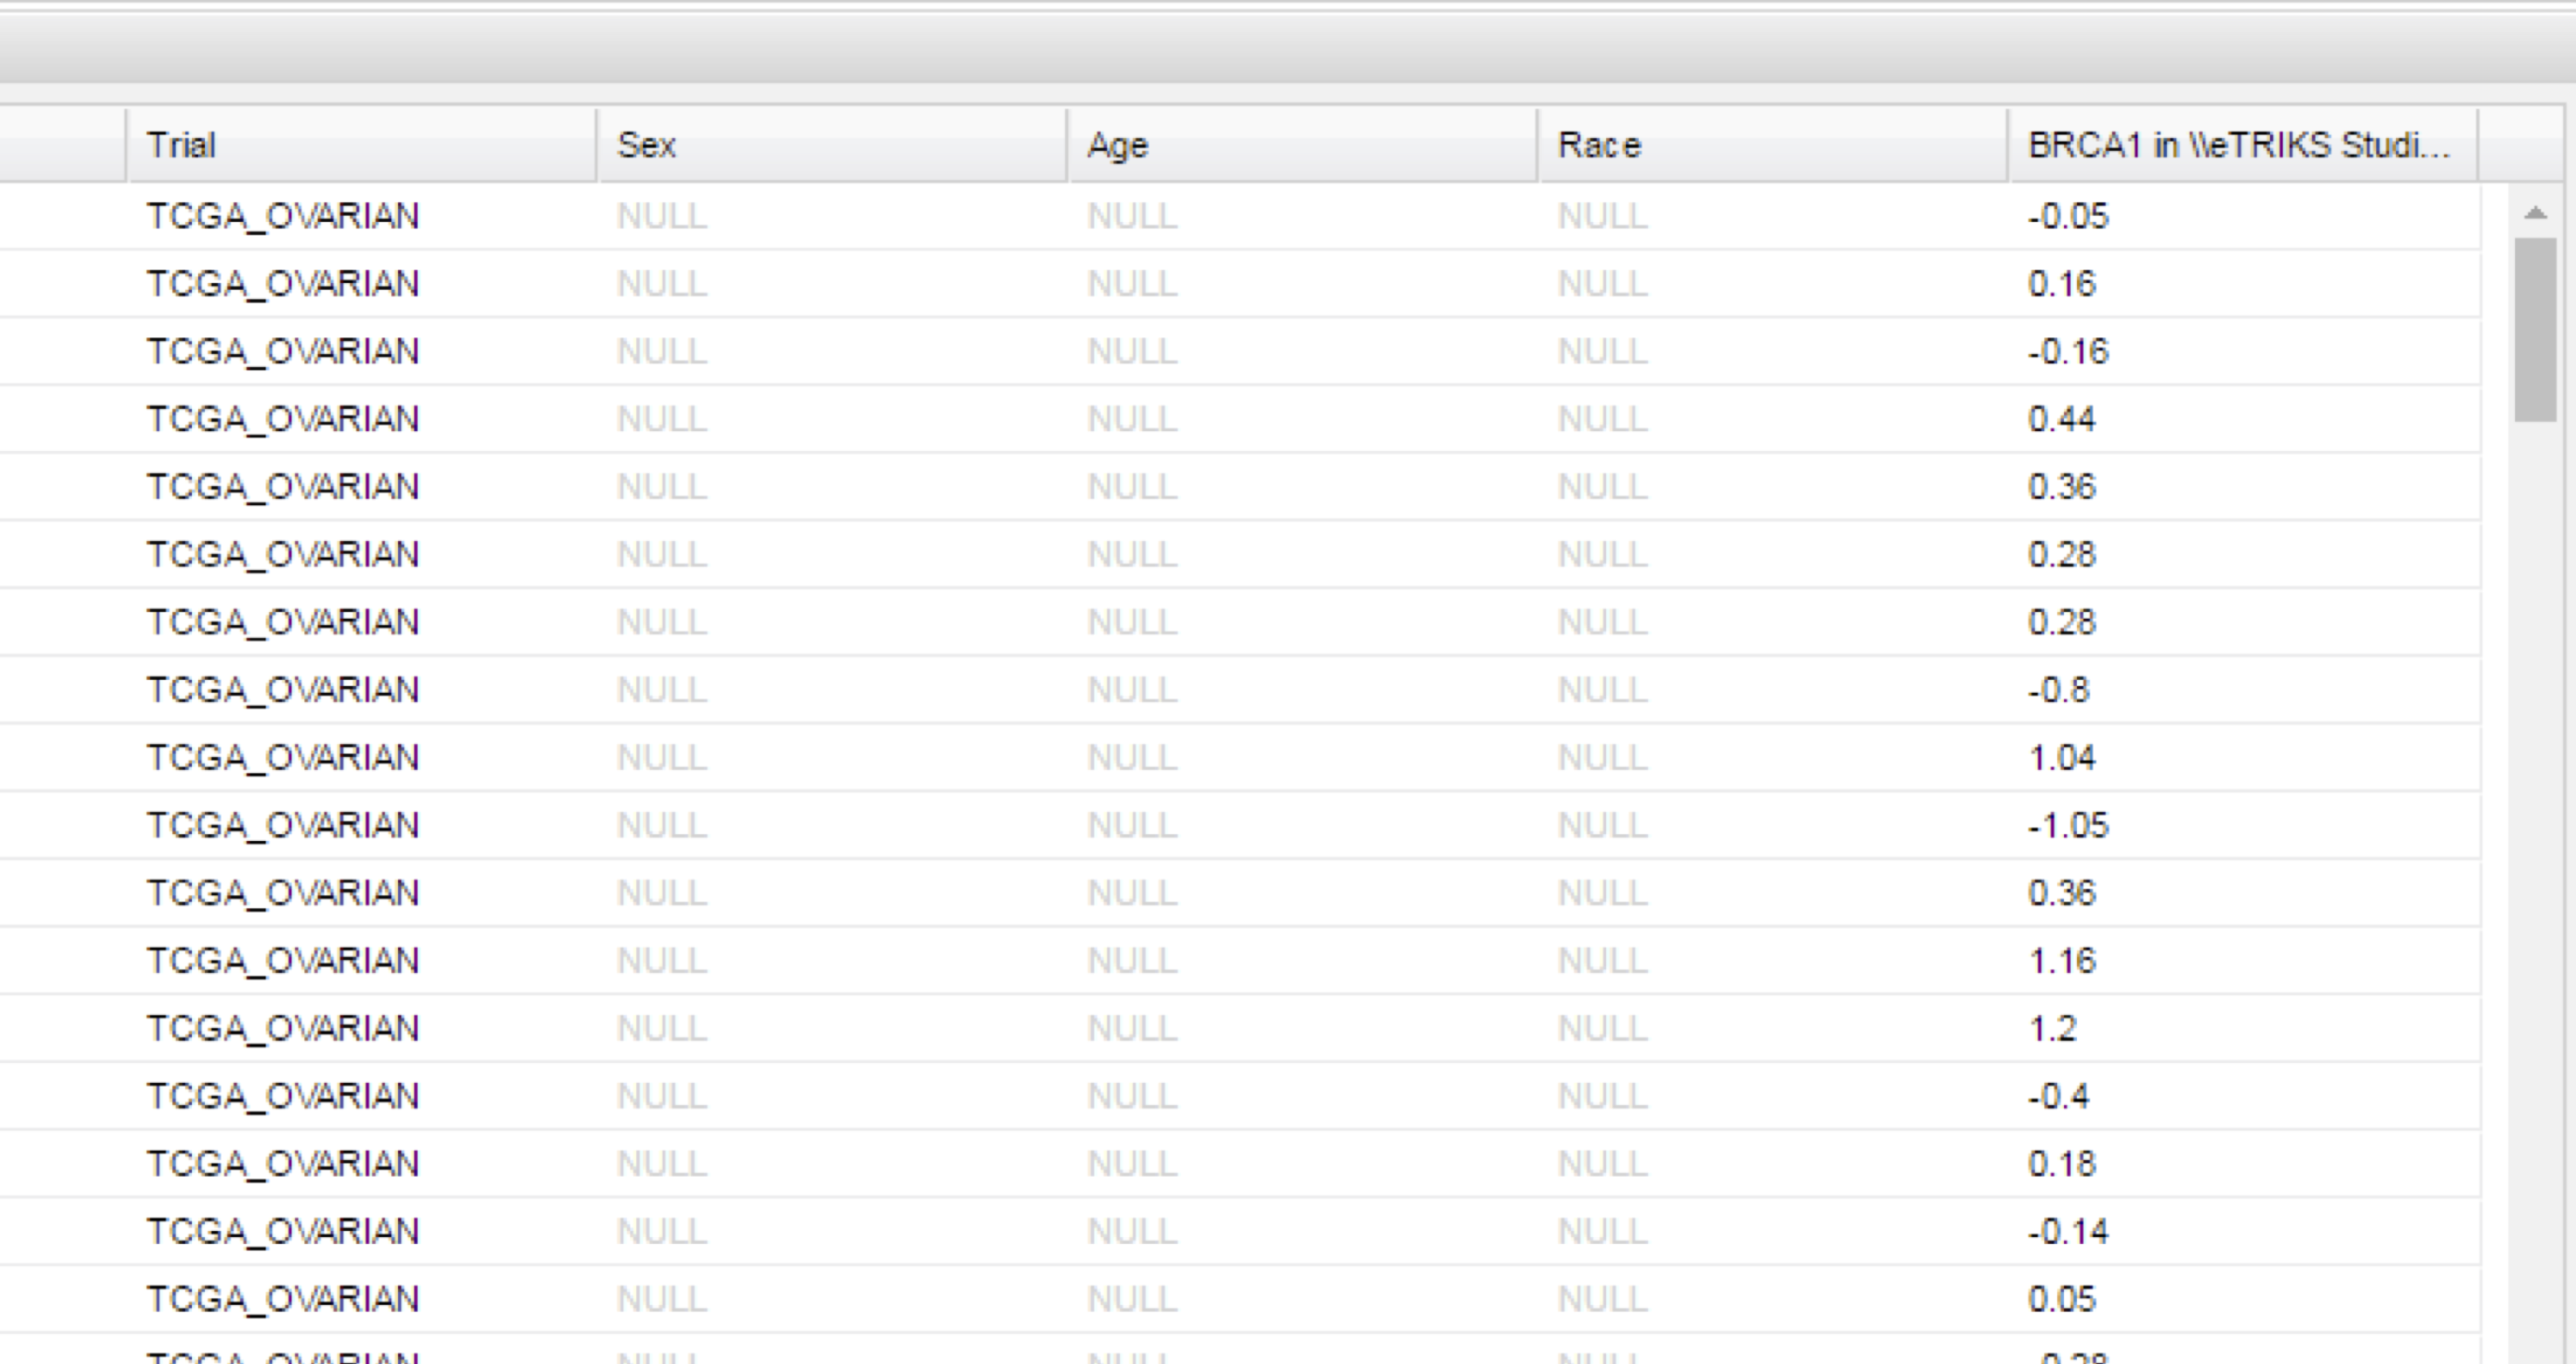
HiDome can also be used in the Summary Statistics and Grid View to show values for a specific biomarker upon dragging a high dimensional node into the window.