Summary Statistics
This chapter explains how to quickly review basic statistics about the cohorts you use for analyses.
Generating Summary Statistics
Once you have finished defining criteria for the cohorts to compare — the subsets — then click the Summary Statistics button.
Note
As an alternative to generating summary statistics, you can view a breakdown of a particular subset by a selected concept (see View Subset Breakdown by Concept).
tranSMART displays tables and charts of information that describe the subsets. The information is displayed in Summary Statistics view in the following sections:
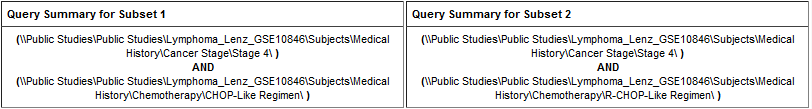
A summary of the criteria used to define subsets to compare.
For example:
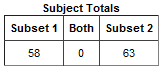
A table showing the number of subjects in each subset that match the subset criteria.
For example:
In this example, 58 subjects matched the criteria for Subset 1 and 63 matched the criteria for Subset 2. No (0) subjects matched the criteria for both subsets.
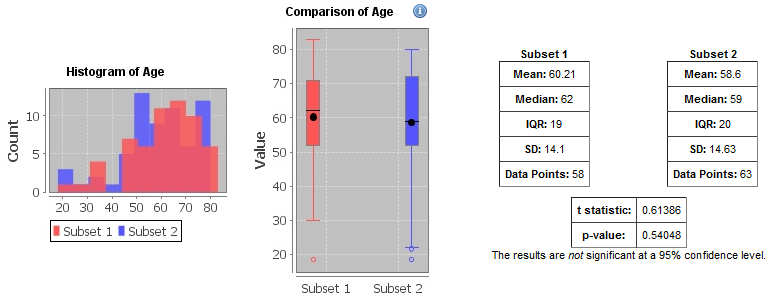
Tables and charts that show how the subjects who match the criteria fit into age, sex, and race demographics.
This example shows the age portion of the demographics data only:
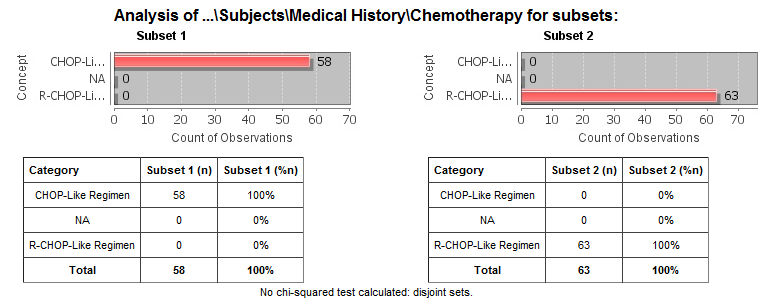
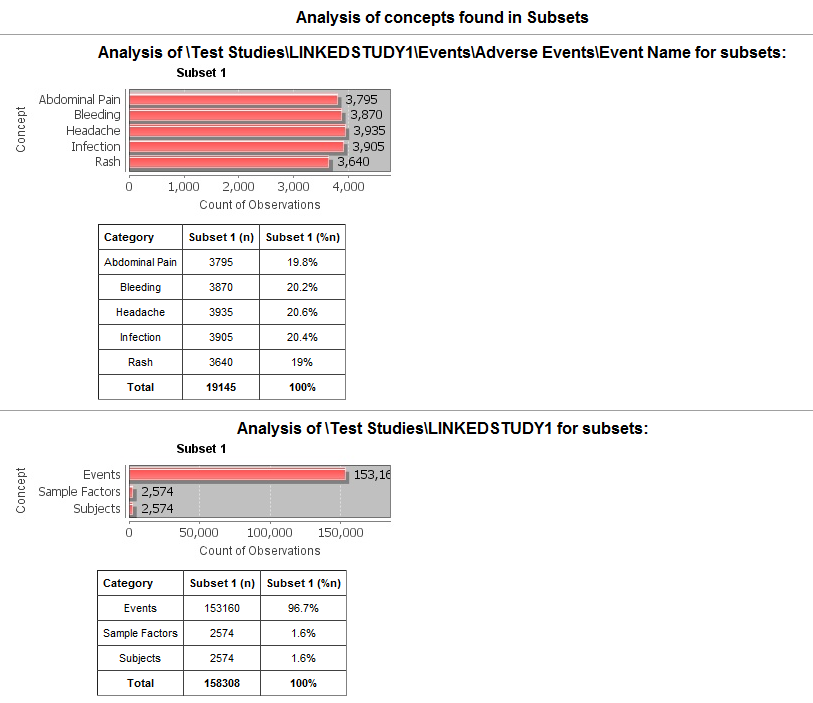
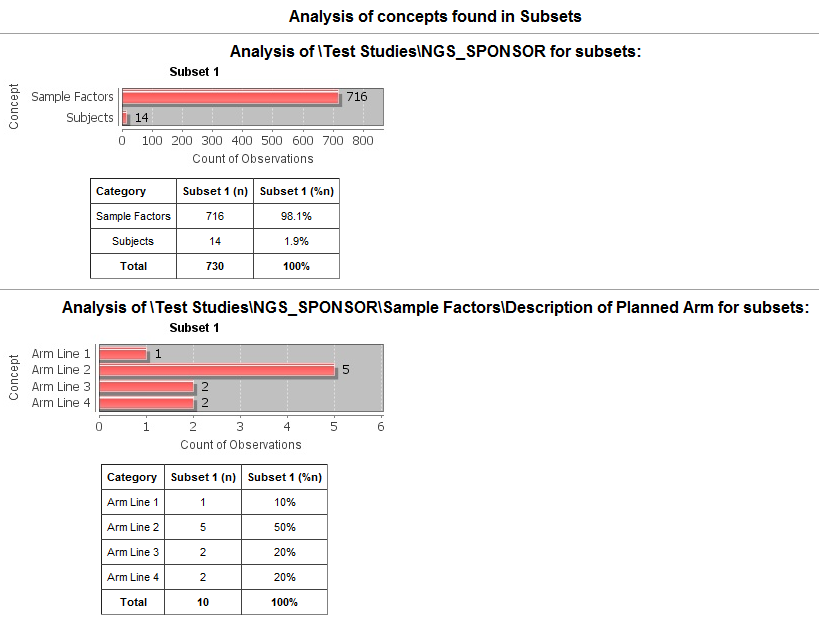
Analyses of the concepts you added to the subsets from the navigation tree. The data displayed reflects the data used to generate the summary statistics.
The next examples show analysis of concepts for a non-linked event, a linked event, and NGS data.
Example 1: Non-linked event.: this example shows the analysis of the chemotherapy concept.
Example 2: Linked event.: this example shows the analysis of concepts for adverse events.
Example 3: NGS data.: this example shows the analysis of concepts for description of planned arm.
Significance Tests
The analyses include the results of significance testing that Analyze performs:
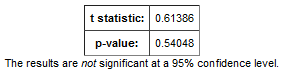
Significance testing is designed to indicate whether the reliability of the statistics is 95% or greater, based on p-value.
Analyze calculates the significance result using either t-test or chi-squared statistics to determine the p-value:
For continuous variables (for example, subject weight or age), a t-test compares the observed values in the two subsets.
For categorical values (for example, diagnoses), a chi-squared test compares the counts in the two subsets.
See this for the Java methods that calculate the chi-squared and t-test statistic.
If there is not enough data to calculate a test, Analyze displays a message indicating the insufficient quantity of data. In addition, significance test results are not displayed in the following circumstances:
If two identical subsets are defined. In this case, the significance test results are not meaningful.
If all subjects in the first subset have one set of values for the categorical value and all subjects in the second subset have other categorical values. For example, suppose you set Subset 1 to contain only males and Subset 2 to contain only females. If you then try to show statistics by gender, tables similar to the following would result:
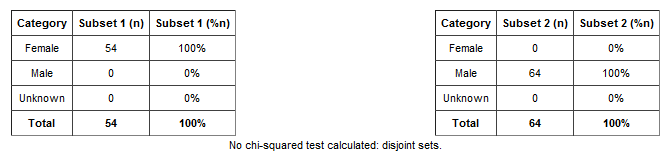
In this case, the chi-squared function doesn’t return meaningful results.
View Subset Breakdown by Concept
Generating summary statistics provides data for all subsets defined by study cohorts. You can view data for a particular subset, however, as follows:
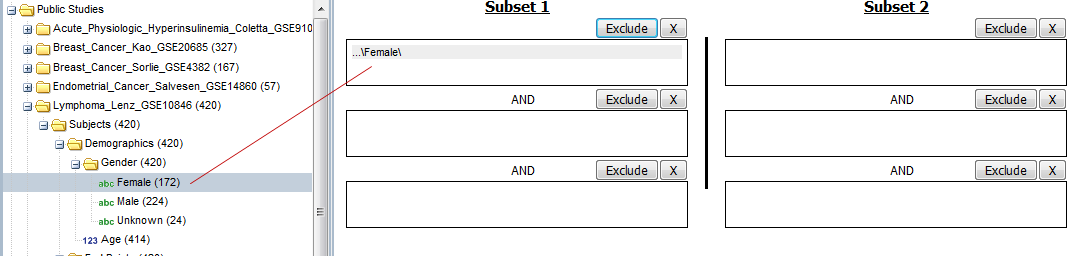
Select a cohort from the navigation tree and drag it into a subset; for example:
Click the Summary Statistics tab.
Drag and drop a folder from the navigation tree into the empty page; for example:
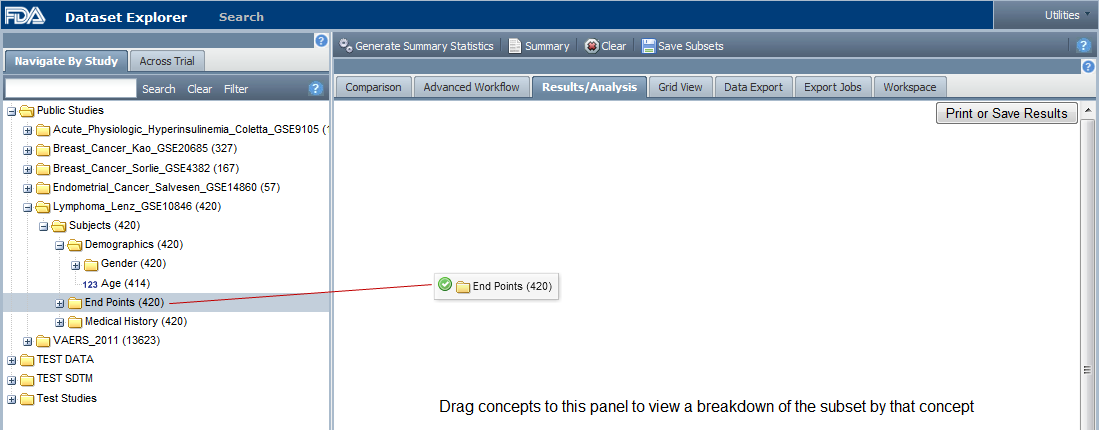
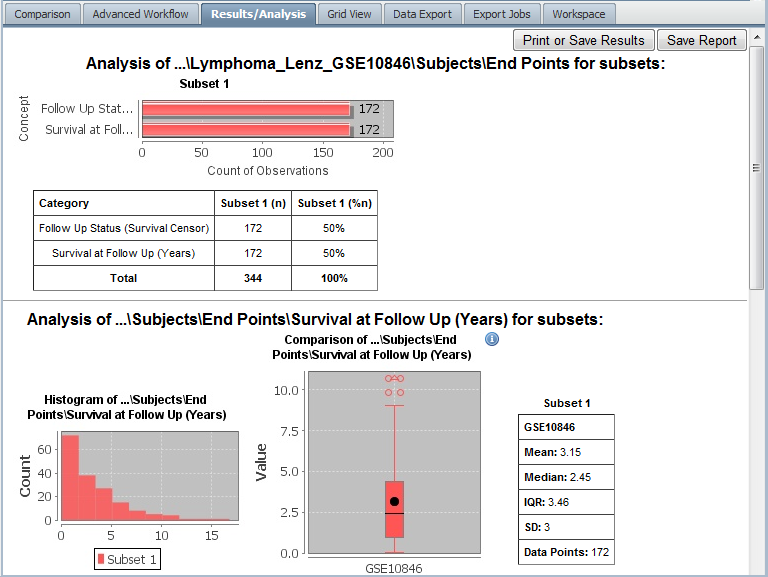
tranSMART calculates the results and displays the data for the given subset and concept:
Note
The Summary Statistics allows you to use high dimensional data as well, see HiDome.
Defining Points of Comparison
Once you establish the subsets of subjects that you want to compare, you can apply one or more points of comparison to the subsets. A point of comparison is a concept in the navigation tree.
To apply a point of comparison to the subsets:
- You must already have defined the subsets and have generated summary statistics for the subsets, as described in the previous section.
- Drag the concept that you want to introduce as the point of comparison from the navigation tree and drop it anywhere inside the Summary Statistics view.
As soon as you drop the point of comparison into the Summary Statistics view, tranSMART begins to compare the subsets based on that point of comparison. When finished, tranSMART displays a side-by-side summary of how the subjects in each subset match or respond to the point of comparison.
Results of a Comparison
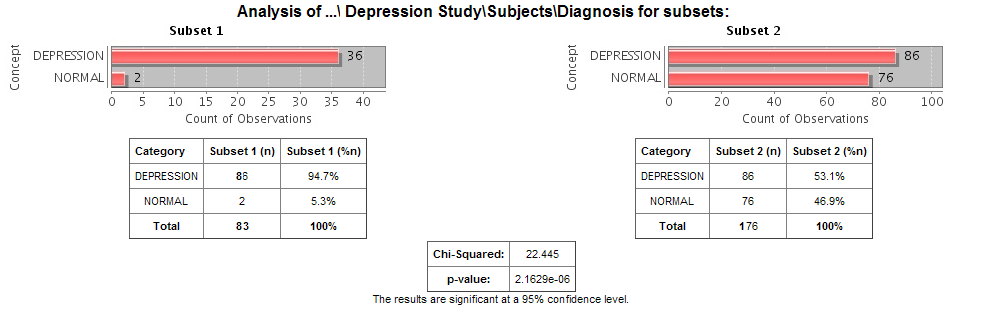
In a comparison of subjects in a psychological study, suppose Subset 1 contains subjects with a substance abuse problem and Subset 2 contains subjects with no substance abuse assessment.
After the subsets are defined and summary statistics are generated, a diagnosis of depression is dropped into the Summary Statistics view as a point of comparison. tranSMART displays a side-by-side comparison of the subjects in each subset, indicating that almost all the subjects with a substance abuse problem have been diagnosed with depression, while that diagnosis for those with no substance abuse problem is more evenly split.
The comparison is placed at the top of the Summary Statistics view, above the demographic definitions plus any other earlier comparisons:
Note
To keep the size of the preceding figure within production limits, the demographics (age, sex, and race) portions of the figure are excluded.
Note
Query details accessed through the Summary button do not reflect points of comparison.
Printing the Contents of Summary Statistics View
You can print the contents of Summary Statistics view as shown below.
In Summary Statistics view, click the Print button:
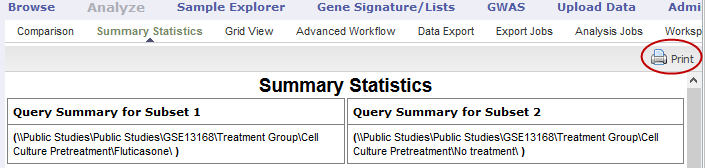
The entire contents of Summary Statistics view appear in a separate browser window.
Click Print this page.
Viewing Data in Grid View
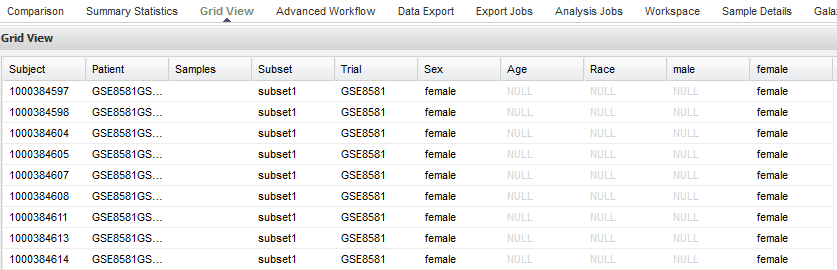
If you are displaying data in the various tables and charts of Summary Statistics view, and want to view the data in a single table, use the Grid View option.
Access Grid View as follows:
Click the Analyze tool and define your cohorts as described earlier in this chapter.
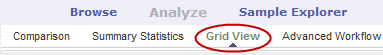
Click Summary Statistics.
Click Grid View.
Optionally, you can drag and drop additional points of comparison into the grid, and new columns will appear for that data.
You can drag a node from any level of the tree into the grid.
Sample of Grid View for a public study:
Note
The ID assigned in the Subject column is the internal tranSMART ID that is assigned at the time of data loading. The ID in the Patient field contains the original subject ID that was provided in the data.
And, also the Grid View allows you to use high dimensional data, see HiDome.
Grid View Display Options
Sort the grid by a specific column. Click the down-arrow icon (
 ) next to the column heading you want to sort by, then
select Sort Ascending or Sort Descending.
) next to the column heading you want to sort by, then
select Sort Ascending or Sort Descending.Hide or redisplay columns. Click the down-arrow icon next to any column heading, click Columns as shown below, then select or deselect columns to hide or redisplay:
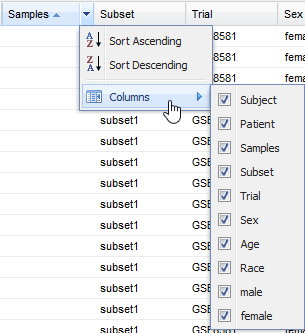
If a column name does not appear in the menu, you have not included the associated concept in the analysis. For example, Diagnosis has not been included in the analysis above.