Appendix A: Download R Data
Analyses run through the Advanced Workflow tool within Analyze use R for computation. tranSMART allows you to:
- Download data files that were exported from the tranSMART database for use in an analysis. These files can then be used in other external tools.
- Download the R scripts that tranSMART used in the generation of an analysis.
- Review the R version information used for a particular analysis.
- Export R code and its data from tranSMART so you execute the R code in the R program independently of tranSMART.
Note
For more information on The r Project for Statistical Computing, visit the following site: www.r-project.org.
Downloading Raw R Data
To download advanced workflow analyses as raw R data:
Click the tranSMART Analyze tool to display the Analyze window.
Select the study you want to use and drag it into a subset definition box in Subset 1.
Click the Advanced Workflow tab and select the analysis you want to run.
Define the variables accordingly.
Click Run.
Your analysis appears below the variable selection boxes.
Click Download raw R data at the bottom of the page.
A dialog box similar to the following appears:

Decide whether you want to open the file or save it to your hard drive, then click OK.
Reviewing R Version Information
To review the R version information for an analysis:
Click the tranSMART Analyze tool to display the Analyze window.
Select the study you want to use and drag it into a subset definition box in Subset 1.
Click the Advanced Workflow tab and select the analysis you want to run.
Define the variables accordingly.
Click Run.
Your analysis appears below the variable selection boxes.
Click R Version Information at the bottom of the page.
The following R version data displays:
Information about the R installation:
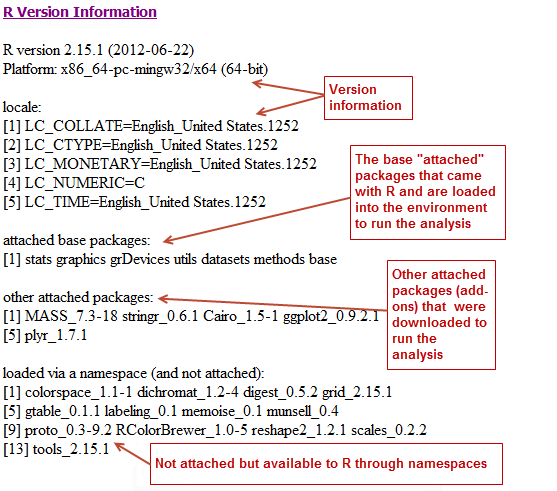
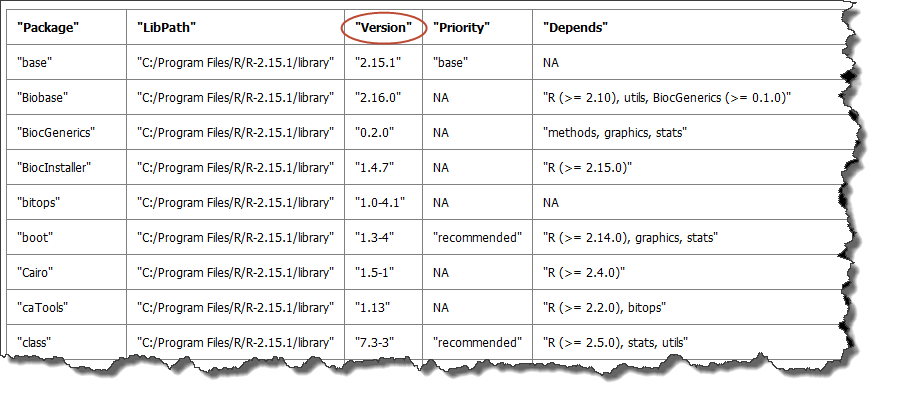
A table of the packages that are included in the installation. Although not all packages may be used, all are listed. The version number is especially useful — if you want to re-create an analysis, the version number indicates the specific version used to create the original analysis.
This sample shows a portion of the table:
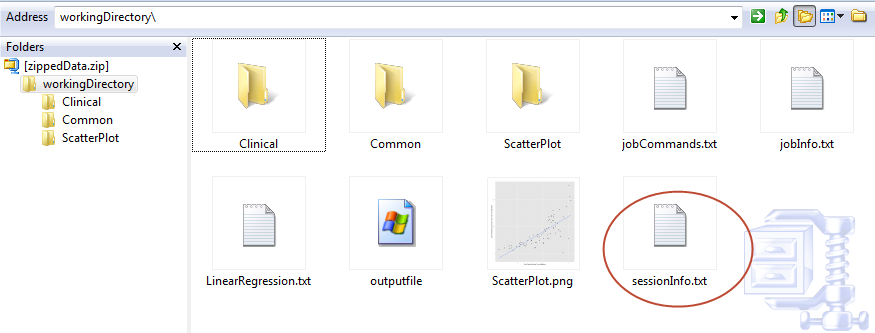
You can view the full table in grid format when you select the Download raw R data option. Just click sessionInfo.txt to open the file:
Export R Code and Data
To export R code and data so it is executable in R:
Click the tranSMART Analyze tool to display the Analyze window.
Select the study you want to use and drag it into a subset definition box in Subset 1.
Click the Advanced Workflow tab and select the analysis you want to run.
Define the variables accordingly.
Click Run.
Your analysis appears below the variable selection boxes.
Click Download raw R Data at the bottom of the page.
A dialog box similar to the following appears:
Open the file and copy the R commands from the file jobcommands.txt.
Be sure you delete the analysis image from the Advanced Workflow page.
Paste the R commands from the downloaded file into R.
Run R. R creates the appropriate analysis image.
Prerequisites for using R
When opening R, change the working directory to your downloaded raw R data folder
# In R environment, set your working directory:
setwd("C:\\users\\username\\Desktop\\workingDirectory").
Install the following packages:
install.packages("plyr")
install.packages("ggplot2")
install.packages("Cairo")
install.packages("rmeta")
install.packages("visreg")
Appendix B: Glossary
Glossary
- aggregate probes
- Used in Analyze, the Aggregate Probes checkbox allows you to group probes used in high-dimensional data samples to form a total quantity that analyses will be performed on.
- analysis of variance (anova)
- Analysis of Variance (ANOVA) is a statistical method used in Analyze to make concurrent comparisons between two or more means in a box plot.
- analysis view
- Used in the Search tool, the Analysis View option displays the statistically significant analyses from your search filter(s).
- Analyze
- Analyze lets you compare data generated for test subjects in two different cohorts, based on criteria and points of comparison that you specify. Analyze is useful to help you test a hypothesis that involves the criteria and points of comparison that you select.
- anti-regulation
- An analysis of a statistically significant experiment returned from a search against a gene signature or list is designated as co-regulated or anti-regulated.
- array data
- See: Microarray
- arrayexpress
Database of gene expression and other microarray data at the European Bioinformatics Institute (EBI).
See http://www.ebi.ac.uk/arrayexpress for details.
- binomial distribution
Graph that displays the discrete probability distribution of obtaining n successes out of N Bernoulli trials.
See http://mathworld.wolfram.com/BinomialDistribution.html for details.
- biomarker
- Short for Biological Marker, a biomarker is a key molecular or cellular event that links a specific environmental exposure to a health outcome.
- box plot
- Also known as a Box and Whisker Plot, a box plot is a histogram-like method of displaying data. Box plots are useful when conveying location and variation information in datasets.
- categorical variable
- Also known as a nominal value, a categorical variable is one that has two or more categories, but with no intrinsic ordering to the categories. An example of a categorical value is hair color — there is no way to order these variables from highest to lowest.
- censoring value
- Used in Survival Analyses. The Censoring Value specifies which patients had the event whose time is being measured. For example, if the Time variable selected is Overall Survival Time (Years), an appropriate censoring variable is Patient Death.
- chi squared
Let the probabilities of various classes in a distribution be
 ,
,  , …,
, …,  , with observed frequencies
 ,
,  , …,
, …,  .
.The quantity:
 ,
,is therefore a measure of the deviation of a sample from expectation, where
 is the sample size.
- cohort
- A group of subjects who share specific events or characteristics. Cohorts are defined in the subset definition boxes of the Analyze tool.
- continuous variable
- Continuous variables have an infinite number of values between two points. For example, age or temperature.
- co-regulation
- An analysis of a statistically significant experiment returned from a search against a gene signature or list is designated as co-regulated or anti-regulated.
- correlation analysis
- A type of Regression Analysis, correlation analysis measures the correlation coefficient — the linear association between two variables. Values of the correlation coefficient are always between -1 and +1. A correlation coefficient of +1 indicates that two variables are perfectly related in a positive linear sense, while a correlation coefficient of -1 indicates that two variables are perfectly related in a negative linear sense.
- cox coefficient
- The Cox coefficient refers to the coefficients in a Cox regression model (also known as the proportional hazards model for survival-time). The analysis investigates the effects of one or more variables upon the time a specified event takes to happen. The cox coefficient relates to a hazard; a positive coefficient indicates a worse prognosis, while a negative coefficient indicates a protective effect of the variable.
- data binning
- Defers to a data pre-processing technique used to reduce observation errors and to allow continuous variables to become categorical. Clusters of data are replaced by a value representative of that cluster (often but not necessarily, the central value).
- data warehouse
- A database used for reporting and analysis.
- dataset
- Collection of data, most commonly presented in a tabular form where each column represents a specific variable, and each row represents a value for that variable.
- dependent variable
- In an experiment, the dependent variable is the response that is measured.
differential modulation
- down-regulation
- An analysis of a statistically significant experiment returned from a search against a pathway is designated as up-regulated or down-regulated.
- entrez gene
- Reference sequences for a wide range of species. For details, see http://www.ncbi.nlm.nih.gov/gene/.
- entrez global
Federated search engine that allows users to search various health sciences databases at the National Center for Biotechnology Information (NCBI) website.
See www.ncbi.nlm.nih.gov/Entrez/ for details.
- fold change ratio
- A number describing how much a quantity changes going from an initial to a final value. An initial value of 50 and a final value of 100 corresponds to a fold change of 2 (a two-fold increase).
- gene
- Stretches of DNA and RNA that code for a polypeptide or for an RNA chain. Contains hereditary molecular information LOL.
- gene chip
- See: Microarray
- gene expression
- The flow of genetic information from gene to protein; the process, or the regulation of the process, by which the effects of a gene are manifested; the manifestation of a heritable trait in an individual carrying the gene or genes that determine it.
- gene expression omnibus
- GEO is an international public repository that archives and freely distributes microarray, next-generation sequencing, and other forms of high-throughput functional genomics data submitted by the research community. For more information, see http://www.ncbi.nlm.nih.gov/geo.
- gene set enrichment analysis (gsea)
Computational method that determines whether an a priori defined set of genes shows statistically significant, concordant differences between two biological states (for example, phenotypes).
See http://www.broadinstitute.org/gsea/index.jsp for details.
- gene signature
- A group of genes whose combined expression pattern is uniquely characteristic of a medical condition or other clinical outcome of interest.
- gene symbol
A unique abbreviation of a gene name consisting of italicized uppercase Latin letters and Arabic numbers. we use Entrez as the full list of genes (related to but not identical to HUGO)
See http://www.genenames.org/ for details.
- genecards
Database that offers information about human genes (and mouse homologues).
See http://www.genecards.org for details.
- google scholar
Google application that provides a search of scholarly literature across multiple disciplines and sources.
See http://scholar.google.com for details.
- gpl platform
- A Platform record is composed of a summary description of the array or sequencer and, for array-based Platforms, a data table defining the array template. Each Platform record is assigned a unique and stable GEO accession number (GPLxxx). A Platform may reference many Samples that have been submitted by multiple submitters.
- heatmap
- Display of differential expression. Individual values contained in the matrix are represented by colors.
- hierarchical clustering
- Hierarchical clustering is a type of clustering analysis whose goal is to organize data so that the objects in the same cluster are more similar to each other than to those in other clusters.
- high dimensional data
- Datasets where the intersection of a subject and measurement is comprised of hundreds or thousands of points. For example, in a low dimensional data measurement such as height, the intersection of subject and measurement is one number (ex. 180 cm), whereas in a high dimensional data measurement such as gene expression in a lymph node, the measurement is 50,000 individual probe expression values.
- histogram
- A visual representation of the distribution of data values within a dataset.
- homology
- The basis for comparative biology — where organs/structures from one organism are compared to a similar organ/structure in a different organism.
- in vitro study
- Those that are conducted using components of an organism that have been isolated from their usual biological surroundings.
- in vivo studies
- Experimentation using a whole, living organism.
- independent variable
- In an experiment, the independent variable is the variable that is manipulated.
- job
- In Valhalla, a job refers to a command you have given Analyze to process or export data. Jobs and job-related events can be found within the Jobs tab in Analyze.
- kendall correlation
- Kendall’s rank correlation provides a distribution-free test of independence and a measure of the strength of dependence between two variables.
- k-means clustering
- The K-Means clustering heatmap clusters genes and/or samples into a specified number of clusters. The result is k clusters, each centered around a randomly-selected data point.
- line graph
- Line graphs illustrate the temporal relationship between two major variables.
- marker selection
- Marker Selection is a display of the top differentially expressed genes between two specified cohorts.
- mesh ontology
- MeSH is the National Library of Medicine’s controlled vocabulary thesaurus. It consists of sets of terms naming descriptors in a hierarchical structure that permits searching at various levels of specificity.
- microarray
- A two-dimensional array on a chip or solid surface that assays large amounts of DNA material.
- mrna analysis
- Assays that quantify the expression levels of all mRNA molecules in an experiment.
- navigation tree
- The Window’s Explorer-like, hierarchical representation of study data that has been loaded into Analyze.
- ncbi
The National Center for Biotechnology Information.
See http:// www.ncbi.nlm.nih.gov/ for details.
- numeric-node
- Used in Analyze, numeric-nodes are indicated by the (123) symbol, numeric nodes indicate that the data values associated with the concept are only numeric (for example, age values, date values, etc.). For more information, see Continuous Variable.
- ontology
- A hierarchical description of the concepts and relationships that can exist for an agent or a community of agents.
- orthogonal component
- When performing statistical analysis, independent variables that affect a particular dependent variable are said to be orthogonal if they are uncorrelated, since the covariance forms an inner product.
- pathology
- The study of diagnosis and disease.
- pathway
- A group of genes interacting to form an aggregate biological function.
- pearson correlation
- Obtained by dividing the covariance of the two variables by the product of their standard deviations
- principal component analysis
- A Principal Component Analysis (PCA) is commonly used as a tool in exploratory data analysis. Data is split into orthogonal components, and the genes/probes that contribute the most variance to the components are displayed.
- probe set
- A probe set is a collection of probes designed to interrogate a given sequence.
- probe set id
A probe set ID is used to refer to a probe set, which looks like the following:
12345_at or 12345_a_at or 12345_s_at or 12345_x_at
The last three characters (_at) identify the probe set strand.
- p-value
- The number corresponding probability that the occurrences of your experiment and analysis did not happen by chance. P-value cutoffs are often 0.05 or 0.01 — when the value is under the threshold, the result is said to be statistically significant.
- r
R is a language and environment for statistical computing and graphics.
See http://www.r-project.org for details.
- rbm data
- Rules Based Medicine. They provide an array measurement of metabolites
- regression algorithms
- Algorithms that are particularly suited for mining data sets that have high dimensionality (many attributes), including transactional and unstructured data.
- rho-value
- Also known as Spearman’s rho, the rho-value is a non-parametric measure of statistical dependence between two variables. See: Spearman Correlation.
- r-value
- The value assigned to a correlation coefficient.
- scatter plot
- Type of graph that uses Cartesian coordinates to display values for two variables for a set of data.
- search filter
- A biomedical concept used to define search criteria in the Search tool.
- search string
- A sequence of biomedical concepts used to define search criteria in the Search tool.
- slope
- The steepness of the line of best fit in a graph (∆y/∆x).
- snp data
- Single Nucleotide Polymorphism. DNA sequence data marking variation occurring when a single nucleotide — A, T, C or G — in the genome.
- spearman correlation
- The Spearman’s rank-order correlation is the nonparametric version of the Pearson product-moment correlation. Spearman’s correlation coefficient, (, also signified by rho-value) measures the strength of association between two ranked variables.
- statistical significance
- Results of analyses on data that are statistically significant indicate a confidence level that the results did not happen by chance.
- subset
- A smaller grouping of participants in a study. See cohort.
- survival analysis
- Assessment of the amount of time that a person or population lives after a particular intervention or condition.
- t statistic
- Ratio of the departure of an estimated parameter from its notional value and its standard error.
- table with fisher test
- Examines the significance of associated categorical variables.
- tea analyses
- Target Enrichment Analysis (TEA) measures the enrichment of a gene signature, gene list, or pathway in a microarray expression experiment.
- tea p-value
- These normalized p‑values are intermediate values in the TEA calculation. To be considered a statistically significant analysis, an analysis must have at least one matching biomarker with a TEA p-Value of less than 0.05.
tea score
- text-node
- Indicated by the (abc) symbol, text nodes indicate that the data values associated with the concept are only textual (for example, race or gender). For more information, see Categorical Variable.
- tissue type
- The specific type of tissue that has been used in the experiment (for example, breast tissue, lung tissue, etc.)
- up-regulation
- An analysis of a statistically significant experiment returned from a search against a pathway is designated as up-regulated or down-regulated.
- x-axis
- The horizontal axis of a two-dimensional Cartesian coordinate system.
- y-axis
- The vertical axis of a two-dimensional Cartesian coordinate system.